
Research ArticleImmunologyOncology
Open Access |  10.1172/jci.insight.197404
DNA delivered by lipid nanoparticles induces CD8+ T cell–dependent antitumor responses and enhances anti–PD-L1 therapy
Seoyun Yum,1 Alba Rodríguez-Garcia,2 Joan Castellsagué,2 Marta Giménez-Alejandre,2 Guillem Colell,2 Salut Colell,2 Teresa Lobo-Jarne,2 Mark A. LaRue,1 Michael A. Minnier,1 Mustafa N. Yazicioglu,1 Rui Zhang,1 Xavier M. Anguela,1 Ali Nahvi,1 Matthew C. Walsh,1 Sean M. Armour,1 Sonia Guedan,2 and Pedro J. Cejas1
1Discovery Group, Spark Therapeutics Inc., Philadelphia, Pennsylvania, USA.
2Cellular Immunotherapies for Cancer Group, Institut d’Investigacions Biomèdiques August Pi i Sunyer (IDIBAPS), Barcelona, Spain.
Address correspondence to: Sonia Guedan, IDIBAPS, Carrer del Rosselló 149-153, 08036 Barcelona, Spain. Phone: 34.93.227.5400 ext. 4528; Email: sguedan@recerca.clinic.cat. Or to: Pedro J. Cejas, Spark Therapeutics Inc., 3025 Market Street, Philadelphia, Pennsylvania 19104, USA. Phone: 305.753.5259; Email: pedro.cejas@sparktx.com.
Authorship note: SY and ARG have been designated as co–first authors. SG and PJC have been designated as co–senior authors.
Find articles by Yum, S. in: PubMed | Google Scholar
1Discovery Group, Spark Therapeutics Inc., Philadelphia, Pennsylvania, USA.
2Cellular Immunotherapies for Cancer Group, Institut d’Investigacions Biomèdiques August Pi i Sunyer (IDIBAPS), Barcelona, Spain.
Address correspondence to: Sonia Guedan, IDIBAPS, Carrer del Rosselló 149-153, 08036 Barcelona, Spain. Phone: 34.93.227.5400 ext. 4528; Email: sguedan@recerca.clinic.cat. Or to: Pedro J. Cejas, Spark Therapeutics Inc., 3025 Market Street, Philadelphia, Pennsylvania 19104, USA. Phone: 305.753.5259; Email: pedro.cejas@sparktx.com.
Authorship note: SY and ARG have been designated as co–first authors. SG and PJC have been designated as co–senior authors.
Find articles by Rodríguez-Garcia, A. in: PubMed | Google Scholar
1Discovery Group, Spark Therapeutics Inc., Philadelphia, Pennsylvania, USA.
2Cellular Immunotherapies for Cancer Group, Institut d’Investigacions Biomèdiques August Pi i Sunyer (IDIBAPS), Barcelona, Spain.
Address correspondence to: Sonia Guedan, IDIBAPS, Carrer del Rosselló 149-153, 08036 Barcelona, Spain. Phone: 34.93.227.5400 ext. 4528; Email: sguedan@recerca.clinic.cat. Or to: Pedro J. Cejas, Spark Therapeutics Inc., 3025 Market Street, Philadelphia, Pennsylvania 19104, USA. Phone: 305.753.5259; Email: pedro.cejas@sparktx.com.
Authorship note: SY and ARG have been designated as co–first authors. SG and PJC have been designated as co–senior authors.
Find articles by Castellsagué, J. in: PubMed | Google Scholar
1Discovery Group, Spark Therapeutics Inc., Philadelphia, Pennsylvania, USA.
2Cellular Immunotherapies for Cancer Group, Institut d’Investigacions Biomèdiques August Pi i Sunyer (IDIBAPS), Barcelona, Spain.
Address correspondence to: Sonia Guedan, IDIBAPS, Carrer del Rosselló 149-153, 08036 Barcelona, Spain. Phone: 34.93.227.5400 ext. 4528; Email: sguedan@recerca.clinic.cat. Or to: Pedro J. Cejas, Spark Therapeutics Inc., 3025 Market Street, Philadelphia, Pennsylvania 19104, USA. Phone: 305.753.5259; Email: pedro.cejas@sparktx.com.
Authorship note: SY and ARG have been designated as co–first authors. SG and PJC have been designated as co–senior authors.
Find articles by Giménez-Alejandre, M. in: PubMed | Google Scholar
1Discovery Group, Spark Therapeutics Inc., Philadelphia, Pennsylvania, USA.
2Cellular Immunotherapies for Cancer Group, Institut d’Investigacions Biomèdiques August Pi i Sunyer (IDIBAPS), Barcelona, Spain.
Address correspondence to: Sonia Guedan, IDIBAPS, Carrer del Rosselló 149-153, 08036 Barcelona, Spain. Phone: 34.93.227.5400 ext. 4528; Email: sguedan@recerca.clinic.cat. Or to: Pedro J. Cejas, Spark Therapeutics Inc., 3025 Market Street, Philadelphia, Pennsylvania 19104, USA. Phone: 305.753.5259; Email: pedro.cejas@sparktx.com.
Authorship note: SY and ARG have been designated as co–first authors. SG and PJC have been designated as co–senior authors.
Find articles by Colell, G. in: PubMed | Google Scholar
1Discovery Group, Spark Therapeutics Inc., Philadelphia, Pennsylvania, USA.
2Cellular Immunotherapies for Cancer Group, Institut d’Investigacions Biomèdiques August Pi i Sunyer (IDIBAPS), Barcelona, Spain.
Address correspondence to: Sonia Guedan, IDIBAPS, Carrer del Rosselló 149-153, 08036 Barcelona, Spain. Phone: 34.93.227.5400 ext. 4528; Email: sguedan@recerca.clinic.cat. Or to: Pedro J. Cejas, Spark Therapeutics Inc., 3025 Market Street, Philadelphia, Pennsylvania 19104, USA. Phone: 305.753.5259; Email: pedro.cejas@sparktx.com.
Authorship note: SY and ARG have been designated as co–first authors. SG and PJC have been designated as co–senior authors.
Find articles by Colell, S. in: PubMed | Google Scholar
1Discovery Group, Spark Therapeutics Inc., Philadelphia, Pennsylvania, USA.
2Cellular Immunotherapies for Cancer Group, Institut d’Investigacions Biomèdiques August Pi i Sunyer (IDIBAPS), Barcelona, Spain.
Address correspondence to: Sonia Guedan, IDIBAPS, Carrer del Rosselló 149-153, 08036 Barcelona, Spain. Phone: 34.93.227.5400 ext. 4528; Email: sguedan@recerca.clinic.cat. Or to: Pedro J. Cejas, Spark Therapeutics Inc., 3025 Market Street, Philadelphia, Pennsylvania 19104, USA. Phone: 305.753.5259; Email: pedro.cejas@sparktx.com.
Authorship note: SY and ARG have been designated as co–first authors. SG and PJC have been designated as co–senior authors.
Find articles by Lobo-Jarne, T. in: PubMed | Google Scholar
1Discovery Group, Spark Therapeutics Inc., Philadelphia, Pennsylvania, USA.
2Cellular Immunotherapies for Cancer Group, Institut d’Investigacions Biomèdiques August Pi i Sunyer (IDIBAPS), Barcelona, Spain.
Address correspondence to: Sonia Guedan, IDIBAPS, Carrer del Rosselló 149-153, 08036 Barcelona, Spain. Phone: 34.93.227.5400 ext. 4528; Email: sguedan@recerca.clinic.cat. Or to: Pedro J. Cejas, Spark Therapeutics Inc., 3025 Market Street, Philadelphia, Pennsylvania 19104, USA. Phone: 305.753.5259; Email: pedro.cejas@sparktx.com.
Authorship note: SY and ARG have been designated as co–first authors. SG and PJC have been designated as co–senior authors.
Find articles by LaRue, M. in: PubMed | Google Scholar
1Discovery Group, Spark Therapeutics Inc., Philadelphia, Pennsylvania, USA.
2Cellular Immunotherapies for Cancer Group, Institut d’Investigacions Biomèdiques August Pi i Sunyer (IDIBAPS), Barcelona, Spain.
Address correspondence to: Sonia Guedan, IDIBAPS, Carrer del Rosselló 149-153, 08036 Barcelona, Spain. Phone: 34.93.227.5400 ext. 4528; Email: sguedan@recerca.clinic.cat. Or to: Pedro J. Cejas, Spark Therapeutics Inc., 3025 Market Street, Philadelphia, Pennsylvania 19104, USA. Phone: 305.753.5259; Email: pedro.cejas@sparktx.com.
Authorship note: SY and ARG have been designated as co–first authors. SG and PJC have been designated as co–senior authors.
Find articles by Minnier, M. in: PubMed | Google Scholar
1Discovery Group, Spark Therapeutics Inc., Philadelphia, Pennsylvania, USA.
2Cellular Immunotherapies for Cancer Group, Institut d’Investigacions Biomèdiques August Pi i Sunyer (IDIBAPS), Barcelona, Spain.
Address correspondence to: Sonia Guedan, IDIBAPS, Carrer del Rosselló 149-153, 08036 Barcelona, Spain. Phone: 34.93.227.5400 ext. 4528; Email: sguedan@recerca.clinic.cat. Or to: Pedro J. Cejas, Spark Therapeutics Inc., 3025 Market Street, Philadelphia, Pennsylvania 19104, USA. Phone: 305.753.5259; Email: pedro.cejas@sparktx.com.
Authorship note: SY and ARG have been designated as co–first authors. SG and PJC have been designated as co–senior authors.
Find articles by Yazicioglu, M. in: PubMed | Google Scholar
1Discovery Group, Spark Therapeutics Inc., Philadelphia, Pennsylvania, USA.
2Cellular Immunotherapies for Cancer Group, Institut d’Investigacions Biomèdiques August Pi i Sunyer (IDIBAPS), Barcelona, Spain.
Address correspondence to: Sonia Guedan, IDIBAPS, Carrer del Rosselló 149-153, 08036 Barcelona, Spain. Phone: 34.93.227.5400 ext. 4528; Email: sguedan@recerca.clinic.cat. Or to: Pedro J. Cejas, Spark Therapeutics Inc., 3025 Market Street, Philadelphia, Pennsylvania 19104, USA. Phone: 305.753.5259; Email: pedro.cejas@sparktx.com.
Authorship note: SY and ARG have been designated as co–first authors. SG and PJC have been designated as co–senior authors.
Find articles by Zhang, R. in: PubMed | Google Scholar
1Discovery Group, Spark Therapeutics Inc., Philadelphia, Pennsylvania, USA.
2Cellular Immunotherapies for Cancer Group, Institut d’Investigacions Biomèdiques August Pi i Sunyer (IDIBAPS), Barcelona, Spain.
Address correspondence to: Sonia Guedan, IDIBAPS, Carrer del Rosselló 149-153, 08036 Barcelona, Spain. Phone: 34.93.227.5400 ext. 4528; Email: sguedan@recerca.clinic.cat. Or to: Pedro J. Cejas, Spark Therapeutics Inc., 3025 Market Street, Philadelphia, Pennsylvania 19104, USA. Phone: 305.753.5259; Email: pedro.cejas@sparktx.com.
Authorship note: SY and ARG have been designated as co–first authors. SG and PJC have been designated as co–senior authors.
Find articles by Anguela, X. in: PubMed | Google Scholar
1Discovery Group, Spark Therapeutics Inc., Philadelphia, Pennsylvania, USA.
2Cellular Immunotherapies for Cancer Group, Institut d’Investigacions Biomèdiques August Pi i Sunyer (IDIBAPS), Barcelona, Spain.
Address correspondence to: Sonia Guedan, IDIBAPS, Carrer del Rosselló 149-153, 08036 Barcelona, Spain. Phone: 34.93.227.5400 ext. 4528; Email: sguedan@recerca.clinic.cat. Or to: Pedro J. Cejas, Spark Therapeutics Inc., 3025 Market Street, Philadelphia, Pennsylvania 19104, USA. Phone: 305.753.5259; Email: pedro.cejas@sparktx.com.
Authorship note: SY and ARG have been designated as co–first authors. SG and PJC have been designated as co–senior authors.
Find articles by Nahvi, A. in: PubMed | Google Scholar
1Discovery Group, Spark Therapeutics Inc., Philadelphia, Pennsylvania, USA.
2Cellular Immunotherapies for Cancer Group, Institut d’Investigacions Biomèdiques August Pi i Sunyer (IDIBAPS), Barcelona, Spain.
Address correspondence to: Sonia Guedan, IDIBAPS, Carrer del Rosselló 149-153, 08036 Barcelona, Spain. Phone: 34.93.227.5400 ext. 4528; Email: sguedan@recerca.clinic.cat. Or to: Pedro J. Cejas, Spark Therapeutics Inc., 3025 Market Street, Philadelphia, Pennsylvania 19104, USA. Phone: 305.753.5259; Email: pedro.cejas@sparktx.com.
Authorship note: SY and ARG have been designated as co–first authors. SG and PJC have been designated as co–senior authors.
Find articles by Walsh, M. in: PubMed | Google Scholar
1Discovery Group, Spark Therapeutics Inc., Philadelphia, Pennsylvania, USA.
2Cellular Immunotherapies for Cancer Group, Institut d’Investigacions Biomèdiques August Pi i Sunyer (IDIBAPS), Barcelona, Spain.
Address correspondence to: Sonia Guedan, IDIBAPS, Carrer del Rosselló 149-153, 08036 Barcelona, Spain. Phone: 34.93.227.5400 ext. 4528; Email: sguedan@recerca.clinic.cat. Or to: Pedro J. Cejas, Spark Therapeutics Inc., 3025 Market Street, Philadelphia, Pennsylvania 19104, USA. Phone: 305.753.5259; Email: pedro.cejas@sparktx.com.
Authorship note: SY and ARG have been designated as co–first authors. SG and PJC have been designated as co–senior authors.
Find articles by Armour, S. in: PubMed | Google Scholar
1Discovery Group, Spark Therapeutics Inc., Philadelphia, Pennsylvania, USA.
2Cellular Immunotherapies for Cancer Group, Institut d’Investigacions Biomèdiques August Pi i Sunyer (IDIBAPS), Barcelona, Spain.
Address correspondence to: Sonia Guedan, IDIBAPS, Carrer del Rosselló 149-153, 08036 Barcelona, Spain. Phone: 34.93.227.5400 ext. 4528; Email: sguedan@recerca.clinic.cat. Or to: Pedro J. Cejas, Spark Therapeutics Inc., 3025 Market Street, Philadelphia, Pennsylvania 19104, USA. Phone: 305.753.5259; Email: pedro.cejas@sparktx.com.
Authorship note: SY and ARG have been designated as co–first authors. SG and PJC have been designated as co–senior authors.
Find articles by Guedan, S. in: PubMed | Google Scholar
1Discovery Group, Spark Therapeutics Inc., Philadelphia, Pennsylvania, USA.
2Cellular Immunotherapies for Cancer Group, Institut d’Investigacions Biomèdiques August Pi i Sunyer (IDIBAPS), Barcelona, Spain.
Address correspondence to: Sonia Guedan, IDIBAPS, Carrer del Rosselló 149-153, 08036 Barcelona, Spain. Phone: 34.93.227.5400 ext. 4528; Email: sguedan@recerca.clinic.cat. Or to: Pedro J. Cejas, Spark Therapeutics Inc., 3025 Market Street, Philadelphia, Pennsylvania 19104, USA. Phone: 305.753.5259; Email: pedro.cejas@sparktx.com.
Authorship note: SY and ARG have been designated as co–first authors. SG and PJC have been designated as co–senior authors.
Find articles by Cejas, P. in: PubMed | Google Scholar
Published March 23, 2026 - More info
JCI Insight. 2026;11(6):e197404. https://doi.org/10.1172/jci.insight.197404.
© 2026 Yum et al. This work is licensed under the Creative Commons Attribution 4.0 International License. To view a copy of this license, visit http://creativecommons.org/licenses/by/4.0/.
Received: June 30, 2025; Accepted: February 4, 2026


-
Results
DNA delivered by LNPs induces an antitumor effect in mouse models of HCC. HCC is an optimal target for DNA-LNP therapy given that standard LNP formulations mainly accumulate in the liver after i.v. administration in both mice and humans (24, 25). We hypothesized that DNA delivery by LNPs to the liver could trigger an innate immune response leading to tumor control.
To test this hypothesis, we first employed a genetically induced mouse model of HCC, driven by the coexpression of c-MET and a constitutively active form of β-catenin (ΔN90). Gaussia luciferase (GLuc) was also expressed for serum-based tumor tracking (26). To express these transgenes in the liver, plasmids encoding oncogenes, GLuc, and the Sleeping Beauty transposase (HSB2) were administered by hydrodynamic tail vein injection (HDTVI). DNA-LNPs were i.v. administered to these mice 3 weeks after tumor induction. Supporting our hypothesis, cytokine analysis in serum 4 hours after treatment revealed a dose-dependent elevation in serum levels of type I IFN (IFN-β); proinflammatory cytokines such as TNF-α, IL-6, and IL-27; and the chemokine CCL2 (MCP-1), all of them indicative of cGAS-STING activation. IFN-γ, although not a direct product of cGAS-STING activation, was also prominently induced upon DNA-LNP treatment. IL-1β, indicative of inflammasome pathway activation, was detectably elevated in the higher-dose treatment group (10 μg) (Figure 1A). This cytokine elevation occurred regardless of tumor presence, as shown in mice that did not receive the plasmids containing the oncogenes (Supplemental Figure 1A; supplemental material available online with this article; https://doi.org/10.1172/jci.insight.197404DS1).
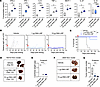 Figure 1
DNA-LNP induces a robust antitumor effect in HCC mouse models. (A–E) HCC was induced by HDTVI of plasmids encoding GLuc, c-MET, β-catenin (ΔN90), and HSB2. Mice received a single dose of DNA-LNP (i.v.) 3 weeks after HCC induction. (A) Serum cytokine levels 4 hours after dosing. (B) Tumor growth indicated by serum GLuc activity. (C) Survival of HCC-bearing mice. (D) Representative images of liver and (E) liver/body weight ratio at endpoints: day 50 for the vehicle and day 114 for the DNA-LNP groups. (F and G) HCC was induced by DEN administration; 36 weeks later, mice received a single dose of DNA-LNP (i.v.). (F) Representative images of the liver and (G) tumor nodule count at 6 weeks after treatment. Min-to-max whiskers are shown in box and whiskers plot. Survival data were analyzed by log-rank (Mantel-Cox) tests, and other data were analyzed by 1-way ANOVA with Tukey’s multiple-comparison test. *P < 0.05, **P < 0.01, ***P < 0.001, and ****P < 0.0001.
Importantly, a single dose of DNA-LNP resulted in potent tumor control, as reflected by reduced GLuc serum levels in treated mice (Figure 1B). No GLuc elevation in serum was observed in mice that did not receive the plasmids containing the oncogenes, confirming that GLuc levels correlated with increasing liver tumor burden (Supplemental Figure 1B). This control in tumor progression by DNA-LNP administration resulted in a marked extension in the survival of treated mice (Figure 1C). Although mice treated with vehicle (PBS) had a mean survival of 50 days after dosing, DNA-LNP–treated mice survived beyond 100 days. At their respective study endpoints, vehicle-treated mice (day 50) exhibited clear signs of liver tumor burden at the macroscopic level, whereas livers from DNA-LNP–treated mice (day 114) appeared healthy (Figure 1D). This was consistent with reduced liver/body weight ratios in the DNA-LNP groups (Figure 1E).
To validate our findings in an alternative model, we utilized a chemically induced HCC mouse model based on the genotoxic carcinogen diethylnitrosamine (DEN), which drives hepatocarcinogenesis through direct DNA damage, more closely resembling the mutational processes observed in patients (27). Specifically, HCC was induced by administering DEN to 14-day-old mice, and a single dose of DNA-LNP was administered 9 months after induction. DNA-LNP administration led to a marked decrease in the number of tumor nodules as assessed 6 weeks after treatment (Figure 1, F and G), further supporting our findings in the genetically induced model. In both HCC models, transient, dose-dependent body weight loss was observed after DNA-LNP treatment (Supplemental Figure 1, C and D). This body weight loss occurred regardless of tumor presence, as shown in mice that did not receive the plasmids containing the oncogenes (Supplemental Figure 1C).
To investigate the key determinants of DNA-LNP–induced antitumor activity, we compared the in vivo activity of noncoding DNA-LNPs with LNPs lacking the DNA payload (empty LNPs) in the genetically induced HCC mouse model. No cytokine response (Figure 2A), antitumor efficacy (Figure 2, B and C), or body weight loss (Figure 2D) were triggered by empty LNPs, confirming that these effects were specifically mediated by cytosolic DNA delivered by LNPs. To further refine the therapeutic window, we tested a lower dose of 0.2 μg DNA-LNP and observed a milder elevation in serum cytokines, following a dose-dependent trend (Figure 2A), but conferred a survival benefit comparable to the 1 μg dose (Figure 2B) without the associated body weight loss (Figure 2D). Systemic cytokine levels at this dose were transiently elevated but returned to baseline within 24 hours (Supplemental Figure 2A). Additionally, 3 weekly doses of 0.2 μg DNA-LNP did not enhance the antitumor effect compared with a single dose (Supplemental Figure 2, B and C). These results suggest that even a low, single dose of DNA-LNP is sufficient to elicit a robust and durable antitumor effect.
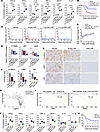 Figure 2
DNA delivered by LNP mediates the antitumor effect in HCC mouse model. HCC was induced by HDTVI of plasmids encoding GLuc, c-MET, β-catenin, and HSB2. (A–I) Mice received a single i.v. dose of DNA-LNP or empty LNP 3 weeks after HCC induction. Empty LNP contains an equivalent amount of empty LNP as 1 μg of DNA-LNP. (A) Serum cytokine levels 4 hours after dosing. (B) Survival of HCC-bearing mice. (C) Tumor growth indicated by serum GLuc activity. (D) Body weight loss measured over time. P value is compared at 1 day after LNP administration. (E) qRT-PCR analysis of oncogenes and ki67 at day 14 after treatment. (F) Quantification and (G) representative images (10×) of IHC analysis of oncogenes and Ki67 in liver sections at day 14 after treatment with 1 μg of DNA-LNP. (H) Volcano plot of differentially expressed genes and (I) GSEA in livers from mice treated with 1 μg of DNA-LNP as compared with vehicle at day 14 after treatment and measured by NanoString. (J and K) Mice received a single i.v. dose of 1 μg of DNA-LNP or DNA2-LNP 4 weeks after HCC induction. (J) Serum cytokine levels 4 hours after dosing. (K) Survival of HCC-bearing mice. Min-to-max whiskers are shown in the box and whiskers plot. Survival data were analyzed by log-rank (Mantel-Cox) tests, and other data were analyzed by 1-way ANOVA with Tukey’s multiple-comparison test. *P < 0.05, **P < 0.01, and ****P < 0.0001.
In line with the observed antitumor activity, analysis of liver tissue 14 days after dosing revealed a reduction in the expression of the oncogenes cMET and β-catenin, as well as the proliferation marker Ki67 in DNA-LNP–treated mice as compared with the groups treated with vehicle or empty LNPs (Figure 2, E–G). These findings were confirmed at both the transcriptional level by RT-PCR (Figure 2E) and at the protein level by IHC (Figure 2, F and G). NanoString gene expression analysis performed at the same time point revealed downregulation of genes involved in pathways related to cell proliferation, immune cell adhesion and migration, and IFN signaling in DNA-LNP–treated mice (Figure 2H). We also performed gene set enrichment analysis (GSEA) of genes differentially expressed in DNA-LNP–treated mice using the Hallmark gene sets. This analysis revealed downregulation in genes associated with pathways linked to HCC tumor progression such as G2M checkpoints or E2F targets (Figure 2I) (28–30). Since our transcriptomic analysis used bulk liver homogenates, the NanoString data may reflect mixed cellular contributions. Nevertheless, taken together, these data suggest a reduction of tumor cells in the liver.
To assess whether DNA payload size and sequence specificity influence antitumor responses, we substituted the 5.1 kb noncoding DNA plasmid used to make DNA-LNPs with a smaller (1.3 kb) noncoding plasmid with a distinct sequence (DNA2). DNA2-LNP elicited a milder cytokine response profile compared with DNA-LNP (Figure 2J), but both DNA-LNPs demonstrated a similar survival benefit (Figure 2K). Together, these results demonstrate that LNP-mediated DNA delivery induces a robust innate immune response, antitumor effect, and extended survival in HCC mouse models.
DNA-LNP induces antitumor effects in nonhepatic tumor models. To evaluate whether DNA-LNP can induce antitumor responses in nonhepatic tumors, we evaluated its effect in mouse models of acute myeloid leukemia (AML), s.c. melanoma, and melanoma lung metastasis.
We first established an AML model by i.v. inoculating C1498 cells into mice. Three days after inoculation, the mice were i.v. dosed with either vehicle (20% glucose-PBS), DNA-LNP, or ADU-S100, a clinically tested STING agonist used as a control. DNA-LNP administration prolonged the survival of C1498 AML-bearing mice in a dose-dependent manner, demonstrating that 10 μg of DNA-LNP was more potent than 50 μg of ADU-S100 (Figure 3A). Importantly, DNA-LNP and ADU-S100 resulted in distinct serum cytokine profiles, with both inducing type I IFNs (IFN-α, IFN-β), cytokines (TNF-α, IL-6), and chemokines (CCL2, CCL4, KC/GRO-α), but only DNA-LNP induced IL-18 and IFN-γ (Figure 3B). IL-18, which was reported to be induced by the AIM2-inflammasome pathway after DNA-LNP dosing (21), is known to enhance production of IFN-γ, a critical factor for antitumor T cell responses (31). Extending the DNA-LNP regimen to 6 doses administered every 3 days did not result in an additional survival benefit compared with the 3-dose schedule (Supplemental Figure 2D). Reducing the frequency of DNA-LNP dosing to 3 doses 6 days apart or 2 doses 12 days apart maintained the antitumor effect observed with the standard schedule of 3 doses administered 3 days apart (Supplemental Figure 3A).
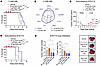 Figure 3
DNA-LNP induces an antitumor effect in nonhepatic tumor models. (A and B) C1498 AML tumor-bearing mice (n = 8) were i.v. dosed with DNA-LNP or ADU-S100 at days 0, 3, and 6. (A) Survival curves. (B) Serum cytokine levels 4 hours after the first dose. Average values are represented as log2 fold-increase over vehicle. (C and D) B16-F10 tumors were inoculated to both sides of mice (n = 8) and intratumorally dosed with treatments at 1 tumor site (local) at days 0, 3, and 6. (C) Tumor growth curves of melanoma-bearing mice. P value indicates comparison to the vehicle-treated group at day 9 unless otherwise indicated. (D) Survival curves. (E) Tumor nodule numbers on the lung surface, tumor area from lung sections, and representative images of the lungs from the B16-F10 lung metastasis model at day 13. Mice (n = 8) were i.v. dosed at days 0, 3, and 6. Data shown as mean ± SD. Survival data were analyzed by log-rank (Mantel-Cox) tests, and other data were analyzed by 2-tailed Student’s t test. *P < 0.05, **P < 0.01, ***P < 0.001, and ****P < 0.0001.
Next, we evaluated the antitumor effect of DNA-LNP in the bilateral s.c. B16-F10 mouse melanoma model. B16-F10 cells were inoculated into both flanks, with one flank (distal) left untreated and the other flank (local) then dosed intratumorally with DNA-LNP or ADU-S100 on a schedule of 3 doses given 3 days apart, a dosing schedule used in previous studies evaluating STING agonists (32, 33). DNA-LNP demonstrated a dose-dependent effect on tumor size of the local flank, and the higher dose of DNA-LNP also reduced the size of the distal tumor (Figure 3C). Consistently, DNA-LNP extended the survival of melanoma-bearing animals in a dose-dependent manner (Figure 3D). Furthermore, a 10 μg dose of DNA-LNP showed a more effective antitumor effect than 10 μg of ADU-S100 (Figure 3, C and D). Reducing the frequency of DNA-LNP dosing to 2 doses 6 days apart still effectively reduced B16-F10 tumor size and prolonged animal survival (Supplemental Figure 3, B and C). Intratumorally dosing DNA-LNP induced detectable levels of cytokines in the serum (Supplemental Figure 4), but cytokine induction was substantially lower compared with i.v. dosing (Figure 3B). For example, the level of serum IFN-α induced by intratumoral administration of 10 μg of DNA-LNP was 13 times lower compared with i.v. administration in the AML model.
Lastly, we assessed the effect of DNA-LNP in a B16-F10 melanoma lung metastasis model. Mice were inoculated with B16-F10 cells via the tail vein, and metastases were allowed to develop in the lungs over a period of 5 days before i.v. administering DNA-LNP or ADU-S100. To evaluate the antitumor effect, lung tissues were isolated 13 days after treatment, and tumor nodules and tumor area were analyzed from the surface and sections of the lung tissue, respectively. Although 50 μg of ADU-S100 did not induce an antitumor effect in the melanoma lung metastasis model, even the low dose (1 μg) of DNA-LNP reduced the number of lung tumor nodules and tumor area (Figure 3E and Supplemental Figure 5).
Overall, the strong antitumor effect induced by both local and systemic dosing of DNA-LNP in multiple nonhepatic tumor models (AML, s.c. melanoma, and melanoma lung metastasis) suggests a generalized therapeutic effectiveness of DNA-LNP that is not limited to a particular tumor type or route of administration.
DNA delivered by LNP mediates the antitumor effect in nonhepatic tumor models. To investigate key determinants of DNA-LNP–induced antitumor activity in nonhepatic tumor models, we prepared DNA-LNP formulations with an alternative ionizable lipid (DNA-LNP2) or encapsulating a shorter (1.3 kb vs. 5.1 kb) noncoding DNA with a distinct sequence (DNA2-LNP), as well as LNPs without payload (empty LNPs).
We evaluated the effect of these LNPs in the AML model after i.v. administration. Empty LNPs did not induce antitumor effects, serum cytokines, or transient body weight loss (Figure 4, A–C), indicating that the immunostimulatory and antitumor effects are specifically mediated by LNP-mediated delivery of DNA. DNA-LNP, DNA-LNP2, and DNA2-LNP showed similar antitumor effect, cytokine profile, and transient body weight loss (Figure 4, A–C). DNA2-LNP showed a milder cytokine profile compared with DNA-LNP (Figure 4B), similar to what we observed in the HCC model (Figure 2J). These results demonstrate that the immunostimulatory and antitumor effects of DNA-LNP are not necessarily specific to a particular DNA payload or ionizable lipid.
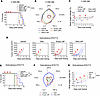 Figure 4
DNA delivered by LNP mediates the antitumor effect in nonhepatic tumor models. (A–C) C1498 AML-bearing mice (n = 8) were i.v. dosed with 5 μg of DNA-LNPs or an equivalent dose of empty LNP at days 0, 3, and 6. (A) Survival curves. (B) Serum cytokine levels 4 hours after dosing. Average values are represented as log2 fold-increase over vehicle. (C) Body weight loss measured over time. Data shown as mean ± SD. (D–G) Mice (n = 4~5) with B16-F10 tumor at 1 side were intratumorally dosed with 10 μg of DNA, DNA-LNP, or an equivalent dose of empty LNP at days 0, 3, and 6. (D) Tumor growth curves. (E) Survival curves. (F) Serum cytokine levels 4 hours after the first dosing. Average values are represented as log2 fold-increase over vehicle. (G) Body weight loss. Statistical analysis was done at 1 day after dosing data using 1-way ANOVA with Tukey’s multiple-comparison test. Survival data were analyzed by log-rank (Mantel-Cox) tests. *P < 0.05, **P < 0.01, ***P < 0.001, ****P < 0.0001, and ns (not significant).
We then evaluated the role of DNA-LNP components in the s.c. B16-F10 model after local administration to the tumor. DNA alone without LNP did not induce antitumor effects, serum cytokines, or body weight loss that was induced by DNA-LNP (Figure 4, D–G), demonstrating a requirement for LNP-mediated DNA delivery. In contrast to i.v. dosing of empty LNPs, local administration of empty LNPs in the melanoma model induced detectable levels of antitumor effects, cytokines, and body weight loss (Figure 4, D–G). However, the antitumor effect from locally dosed empty LNPs was substantially lower than DNA-LNPs (Figure 4E), indicating that DNA delivery is critical for the full antitumor effect of DNA-LNP.
Altogether, these results demonstrate that the immune responses and antitumor effects induced by DNA-LNP require LNP-mediated DNA delivery and that the DNA payload or ionizable lipid can be modified while maintaining the antitumor effect.
DNA-LNP induces CD8+ T cell infiltration of tumor sites and CD8+ T cell–mediated antitumor effect. To investigate the mechanisms underlying the antitumor effects of DNA-LNP, we performed cell-type profiling (NanoString Technologies) to analyze changes after treatment in immune cell infiltration in the livers of mice with genetically induced HCC. Although this analysis was conducted on bulk liver tissue, this method leverages curated multi-gene expression signatures to estimate the relative abundance of specific immune cell populations. At day 5 after treatment, we observed an enrichment of cytotoxic cells (defined by the expression of Prf1, Klrb1, Klrd1, Klrk1, Nkg7, Gzma, Gzmb, and Ctsw) and T cells (defined by the expression of Cd3d, Cd3e, Cd3g, Cd6, Sh2d1a, and Trat1) in the liver, which was resolved by day 14 (Figure 5A). No statistical differences between treated and control mice were observed in exhausted CD8+ T cells (defined by the expression of Cd244, Eomes, Lag3, and Ptger4) or other immune cell populations, including NK cells (Supplemental Figure 6). These findings were further corroborated by RT-PCR, which demonstrated an increase in Cd8a expression in the liver at day 5 but not at day 14 after treatment (Figure 5B). Additionally, although not statistically significant, IHC analysis of liver sections showed a trend of increased CD8+ cells (Figure 5, C and D).
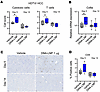 Figure 5
DNA-LNP induces CD8+ T cell infiltration of the liver in HCC mouse model. HDTVI-induced HCC-bearing mice received a single i.v. dose of 1 μg of DNA-LNP 3 weeks after HCC induction. Livers were harvested and analyzed at days 5 and 14 after treatment. (A) Cell-type profiling by NanoString. (B) qRT-PCR analysis of CD8a. (C) Representative images (20×) and (D) quantification of IHC analysis of CD8+ cells from liver sections. Min-to-max whiskers are shown in the box and whiskers plot. Data were analyzed by 1-way ANOVA with Tukey’s multiple-comparison test. *P < 0.05.
In the s.c. B16-F10 melanoma model, intratumoral dosing of DNA-LNP increased the number of total immune cells, CD8+ T cells, and NK cells within the tumor in a dose-dependent manner (Figure 6A and Supplemental Figure 7A). The ratio of CD4+ to CD8+ T cells was reduced by DNA-LNP, suggesting an accumulation of cytotoxic T cells in the tumor (Figure 6B). Furthermore, DNA-LNP upregulated Granzyme B and CD69 in tumor-infiltrating CD8+ T cells and NK cells, indicating activation of these immune cells (Figure 6, C and D, and Supplemental Figure 7, B and C). Moreover, in the B16-F10 lung metastasis model, i.v. dosing of DNA-LNPs increased the number of CD8+ cells in both total and tumor tissue areas, whereas ADU-S100 did not show a difference (Figure 6, E and F).
 Figure 6
DNA-LNP induces CD8+ T cell infiltration of tumor sites and immune cell activation in nonhepatic tumor models. (A–D) B16-F10 tumor-bearing mice (s.c.) were intratumorally dosed with DNA-LNP at days 0 and 3. Tumors were collected at day 7 and analyzed using flow cytometry. (A) Numbers of indicated immune cells per milligram of tumor tissues. (B) CD4/CD8 ratio. (C) Percentage of Granzyme B+ cells and (D) CD69+ cells from CD8+ T cells or NK cells. (E and F) Mice with B16-F10 lung metastasis were i.v. dosed at days 0, 3, and 6, and lung sections were analyzed at day 13 by CD8 IHC. (E) Representative images of lung sections and (F) quantification of CD8+ cells. Min-to-max whiskers are shown in the box and whiskers plot. Data shown as mean ± SD. Data were analyzed by 1-way ANOVA with Tukey’s multiple-comparison test. *P < 0.05, **P < 0.01, ***P < 0.001, and ****P < 0.0001.
To determine whether the increased CD8+ T cell infiltration directly contributes to the antitumor response induced by DNA-LNP, we depleted CD8+ T cells prior to DNA-LNP treatment. In the genetically induced HCC mouse model, the antitumor effect was completely abolished in the absence of CD8+ T cells, as evidenced by the loss of antitumor efficacy (Figure 7A) and decreased animal survival (Figure 7B). Similarly, the prolonged survival effect by DNA-LNP in the C1498 AML model was not observed after depleting CD8+ T cells (Figure 8A). In the s.c. B16-F10 melanoma model, CD8+ T cell depletion reduced but did not completely abolish the antitumor efficacy of DNA-LNP, indicated by reduced tumor growth control (Figure 8B) and shortened animal survival (Figure 8C). This result suggests that although CD8+ T cells are key mediators of DNA-LNP–induced antitumor activity in this model, additional mechanisms may also contribute. NK cells were recruited and activated after DNA-LNP administration in this model (Figure 6, A, C, and D), but their depletion did not result in a substantial loss of antitumor effect (Figure 8, B and C). Further studies will be required to elucidate the additional immune components that mediate the antitumor effect. Together, these data indicate that DNA-LNPs can increase the number and the activity of tumor-infiltrating lymphocytes across multiple tumor models, effectively transforming cold tumors into hot tumors and inducing CD8+ T cell–mediated antitumor effects.
 Figure 7
DNA-LNP induces CD8+ T cell–mediated antitumor effect in HCC mouse model. HDTVI-induced HCC-bearing mice (n = 11) received a single i.v. dose of 1 μg of DNA-LNP 3 weeks after HCC induction. Mice received 200 μg of anti-CD8 or anti-NK1.1 (i.p.) at days –2, 1, 4, and 7 to deplete CD8+ T cells or NK cells, respectively. (A) Tumor growth indicated by serum GLuc activity. (B) Survival curves. Survival data were analyzed by log-rank (Mantel-Cox) tests. *P < 0.05, ***P < 0.001, and ns (not significant).
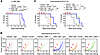 Figure 8
DNA-LNP induces CD8+ T cell–mediated antitumor effect in nonhepatic tumor models. Mouse tumor models received 200 μg of anti-CD8 or anti-NK1.1 (i.p.) at day –2, 1, 4, and 7 to deplete CD8+ T cells or NK cells, respectively. (A) Survival curves of C1498 AML tumor-bearing mice (n = 8) after i.v. administration of 5 μg of DNA-LNP at days 0, 3, and 6. (B) Tumor growth curves and (C) survival curves of B16-F10 tumor-bearing mice (n = 7) after intratumoral administration of 10 μg of DNA-LNP at days 0, 3, and 6. Survival data were analyzed by log-rank (Mantel-Cox) tests. *P < 0.05, **P < 0.01, ***P < 0.001, and ns (not significant).
DNA-LNP enhances the antitumor effect of anti–PD-L1. ICI therapy has limited effectiveness in some patients. Combination therapies are actively being evaluated in clinical trials to amplify therapeutic effects and benefit patients who do not respond to ICIs. To boost the antitumoral effect of low-dose DNA-LNP, we tested DNA-LNP in combination with an ICI, anti–PD-L1. First, we combined the administration of DNA-LNP with anti–PD-L1 antibodies in the genetically induced HCC mouse model. To test the therapy under a more demanding disease setting, treatment start was extended from 3 to 4 weeks after tumor induction. Under these conditions, the monotherapy treatments tested, anti–PD-L1 or DNA-LNP at doses of either 0.2 or 1 μg, resulted in a mild antitumor effect, but failed to control long-term tumor progression (Figure 9A) or to substantially extend mouse survival compared with vehicle-treated mice (Figure 9B). Remarkably, a synergistic effect of the combination treatment was observed for both DNA-LNP doses. At the higher dose (1 μg), 90% of treated mice were disease-free at the study’s endpoint, and at the lower dose (0.2 μg), 70% of animals remained disease-free by day 151 after treatment (Figure 9B).
 Figure 9
DNA-LNP and anti–PD-L1 show synergistic antitumor effects in HCC mouse model. HDTVI-induced HCC models (n = 11) were i.v. dosed with the indicated doses of DNA-LNP 4 weeks after HDTVI to observe a suboptimal antitumor effect. At days 1, 5, 8, and 11, 200 μg of anti–PD-L1 was i.p. dosed. (A) Tumor growth indicated by serum GLuc activity. (B) Survival curves of HCC-bearing mice. Survival data were analyzed by log-rank (Mantel-Cox) tests. *P < 0.05, **P < 0.01, and ns (not significant).
We next evaluated the combination of DNA-LNP with anti–PD-L1 in the s.c. B16-F10 model, which is resistant to anti–PD-L1 treatment. As expected, anti–PD-L1 alone did not have an antitumor effect (Figure 10, A and B). However, when combined with DNA-LNP, anti–PD-L1 enhanced the therapeutic effect, resulting in better control of tumor progression (Figure 10A) and prolonged survival (Figure 10B).
 Figure 10
DNA-LNP and anti–PD-L1 show synergistic antitumor effects in anti–PD-L1-resistant melanoma model. B16-F10 tumor-bearing mice (n = 8) were i.p. dosed with 250 μg of anti–PD-L1 and intratumorally dosed with indicated doses of DNA-LNP at days 0, 3, and 6. (A) Tumor growth curves. (B) Survival curves. Survival data were analyzed by log-rank (Mantel-Cox) tests. *P < 0.05, **P < 0.01, ***P < 0.001, and ns (not significant).
Notably, combining DNA-LNP with anti–PD-L1 antibodies allowed for a reduction in the effective DNA-LNP dose. In both models, low-dose DNA-LNP combined with anti–PD-L1 antibodies achieved a therapeutic effect equivalent to that of a 5-fold higher dose of DNA-LNP alone. Furthermore, the combination with anti–PD-L1 did not exacerbate body weight loss observed with DNA-LNP treatment in any of the tumor models (Supplemental Figure 8, A and B). Therefore, the CD8+ T cell–dependent antitumor activity of DNA-LNPs can be successfully combined with anti–PD-L1 to further boost responses in both models, HCC responsive to anti–PD-L1 and melanoma resistant to anti–PD-L1, suggesting potentially broad application to tumors with varying levels of ICI responsiveness.


