
Research ArticleCell biologyNephrology
Open Access |  10.1172/jci.insight.199699
Apical proximal tubule fatty acid uptake–generated ceramides cause endoplasmic reticulum stress from altered membrane fluidity
Zhiyu Liu,1 Robert J. Gaivin,1 Shenaz Khan,1 Vincent Li,1 Amal Chaba,1 Fraser J. Moss,1 Usman Sabir,2 Takhar Kasumov,2 Tingwei Mu,1 and Jeffrey R. Schelling1,3
1Department of Physiology and Biophysics, Case Western Reserve University, Cleveland, Ohio, USA.
2Department of Pharmaceutical Sciences, Northeast Ohio Medical University, Rootstown, Ohio, USA.
3Department of Medicine, University Hospitals Cleveland Medical Center, Cleveland, Ohio, USA.
Address correspondence to: Jeffrey R. Schelling, Department of Physiology and Biophysics, Case Western Reserve University School of Medicine, 10900 Euclid Avenue, Robbins Building, E515, Cleveland, Ohio 44106, USA. Phone: 216.368.0076; Email: jrs15@case.edu.
Find articles by Liu, Z. in: PubMed | Google Scholar
1Department of Physiology and Biophysics, Case Western Reserve University, Cleveland, Ohio, USA.
2Department of Pharmaceutical Sciences, Northeast Ohio Medical University, Rootstown, Ohio, USA.
3Department of Medicine, University Hospitals Cleveland Medical Center, Cleveland, Ohio, USA.
Address correspondence to: Jeffrey R. Schelling, Department of Physiology and Biophysics, Case Western Reserve University School of Medicine, 10900 Euclid Avenue, Robbins Building, E515, Cleveland, Ohio 44106, USA. Phone: 216.368.0076; Email: jrs15@case.edu.
Find articles by Gaivin, R. in: PubMed | Google Scholar
1Department of Physiology and Biophysics, Case Western Reserve University, Cleveland, Ohio, USA.
2Department of Pharmaceutical Sciences, Northeast Ohio Medical University, Rootstown, Ohio, USA.
3Department of Medicine, University Hospitals Cleveland Medical Center, Cleveland, Ohio, USA.
Address correspondence to: Jeffrey R. Schelling, Department of Physiology and Biophysics, Case Western Reserve University School of Medicine, 10900 Euclid Avenue, Robbins Building, E515, Cleveland, Ohio 44106, USA. Phone: 216.368.0076; Email: jrs15@case.edu.
Find articles by Khan, S. in: PubMed | Google Scholar
1Department of Physiology and Biophysics, Case Western Reserve University, Cleveland, Ohio, USA.
2Department of Pharmaceutical Sciences, Northeast Ohio Medical University, Rootstown, Ohio, USA.
3Department of Medicine, University Hospitals Cleveland Medical Center, Cleveland, Ohio, USA.
Address correspondence to: Jeffrey R. Schelling, Department of Physiology and Biophysics, Case Western Reserve University School of Medicine, 10900 Euclid Avenue, Robbins Building, E515, Cleveland, Ohio 44106, USA. Phone: 216.368.0076; Email: jrs15@case.edu.
Find articles by Li, V. in: PubMed | Google Scholar
1Department of Physiology and Biophysics, Case Western Reserve University, Cleveland, Ohio, USA.
2Department of Pharmaceutical Sciences, Northeast Ohio Medical University, Rootstown, Ohio, USA.
3Department of Medicine, University Hospitals Cleveland Medical Center, Cleveland, Ohio, USA.
Address correspondence to: Jeffrey R. Schelling, Department of Physiology and Biophysics, Case Western Reserve University School of Medicine, 10900 Euclid Avenue, Robbins Building, E515, Cleveland, Ohio 44106, USA. Phone: 216.368.0076; Email: jrs15@case.edu.
Find articles by Chaba, A. in: PubMed | Google Scholar
1Department of Physiology and Biophysics, Case Western Reserve University, Cleveland, Ohio, USA.
2Department of Pharmaceutical Sciences, Northeast Ohio Medical University, Rootstown, Ohio, USA.
3Department of Medicine, University Hospitals Cleveland Medical Center, Cleveland, Ohio, USA.
Address correspondence to: Jeffrey R. Schelling, Department of Physiology and Biophysics, Case Western Reserve University School of Medicine, 10900 Euclid Avenue, Robbins Building, E515, Cleveland, Ohio 44106, USA. Phone: 216.368.0076; Email: jrs15@case.edu.
Find articles by Moss, F. in: PubMed | Google Scholar
1Department of Physiology and Biophysics, Case Western Reserve University, Cleveland, Ohio, USA.
2Department of Pharmaceutical Sciences, Northeast Ohio Medical University, Rootstown, Ohio, USA.
3Department of Medicine, University Hospitals Cleveland Medical Center, Cleveland, Ohio, USA.
Address correspondence to: Jeffrey R. Schelling, Department of Physiology and Biophysics, Case Western Reserve University School of Medicine, 10900 Euclid Avenue, Robbins Building, E515, Cleveland, Ohio 44106, USA. Phone: 216.368.0076; Email: jrs15@case.edu.
Find articles by Sabir, U. in: PubMed | Google Scholar
1Department of Physiology and Biophysics, Case Western Reserve University, Cleveland, Ohio, USA.
2Department of Pharmaceutical Sciences, Northeast Ohio Medical University, Rootstown, Ohio, USA.
3Department of Medicine, University Hospitals Cleveland Medical Center, Cleveland, Ohio, USA.
Address correspondence to: Jeffrey R. Schelling, Department of Physiology and Biophysics, Case Western Reserve University School of Medicine, 10900 Euclid Avenue, Robbins Building, E515, Cleveland, Ohio 44106, USA. Phone: 216.368.0076; Email: jrs15@case.edu.
Find articles by Kasumov, T. in: PubMed | Google Scholar
1Department of Physiology and Biophysics, Case Western Reserve University, Cleveland, Ohio, USA.
2Department of Pharmaceutical Sciences, Northeast Ohio Medical University, Rootstown, Ohio, USA.
3Department of Medicine, University Hospitals Cleveland Medical Center, Cleveland, Ohio, USA.
Address correspondence to: Jeffrey R. Schelling, Department of Physiology and Biophysics, Case Western Reserve University School of Medicine, 10900 Euclid Avenue, Robbins Building, E515, Cleveland, Ohio 44106, USA. Phone: 216.368.0076; Email: jrs15@case.edu.
Find articles by Mu, T. in: PubMed | Google Scholar
1Department of Physiology and Biophysics, Case Western Reserve University, Cleveland, Ohio, USA.
2Department of Pharmaceutical Sciences, Northeast Ohio Medical University, Rootstown, Ohio, USA.
3Department of Medicine, University Hospitals Cleveland Medical Center, Cleveland, Ohio, USA.
Address correspondence to: Jeffrey R. Schelling, Department of Physiology and Biophysics, Case Western Reserve University School of Medicine, 10900 Euclid Avenue, Robbins Building, E515, Cleveland, Ohio 44106, USA. Phone: 216.368.0076; Email: jrs15@case.edu.
Find articles by Schelling, J. in: PubMed | Google Scholar
Published June 18, 2026 - More info
JCI Insight. 2026;11(15):e199699. https://doi.org/10.1172/jci.insight.199699.
© 2026 Liu et al. This work is licensed under the Creative Commons Attribution 4.0 International License. To view a copy of this license, visit http://creativecommons.org/licenses/by/4.0/.
Received: September 2, 2025; Accepted: June 11, 2026


-
Results
Conditional proximal tubule FATP2 deletion ameliorates DKD induced by HFD plus streptozotocin. In mouse models of DKD, global Slc27a2 deletion rescued GFR (22). To determine whether the effect was due to kidney FATP2, mice with conditional proximal tubule knockout were created (42). Streptozotocin-treated (STZ-treated), HFD-fed mice with Slc27a2 deleted weighed less than wild-type mice (Figure 1A). Figure 1B demonstrates that conditional Slc27a2 deletion did not affect fasting blood glucose concentrations, consistent with published results (42). Wild-type, Cre, and floxed control mice treated with HFD plus low-dose STZ developed GFR decline, consistent with previous reports (22). Figure 1C shows that proximal tubule Slc27a2 deletion rescued GFR to near baseline levels in HFD + STZ mice. Albuminuria was also reduced in HFD + STZ mice with conditional Slc27a2 knockout (Figure 1D). The most striking pathologic finding in HFD + STZ kidneys was proximal tubule cytoplasmic vacuoles (presumed lipid droplets; Figure 1, E–H), which were increased in Slc27a2-knockout mice on HFD + STZ (Figure 1H). Because (a) GFR improved in conditional-Slc27a2-KO mice, (b) FATP2 is the predominant proximal tubule FA transporter (21), and (c) within the kidney, FATP2 is expressed exclusively in the AP proximal tubule membrane (21), we conclude that AP FA uptake contributes to DKD pathogenesis.
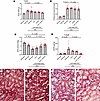 Figure 1
Conditional proximal tubule FATP2 deletion ameliorates HFD + STZ–induced DKD. (A–D) Conditional proximal tubule FATP2 deletion (GGT1-Cre+/– Slc27a2fl/fl) and genotype control mice were generated as described in Methods. At 6 weeks of age, mice were placed on a high-fat diet (HFD) for 6 months and treated with low-dose streptozotocin (STZ) at 3 months to phenocopy kidney disease from type 2 diabetes. At the end of the HFD period, body weight (A), fasting blood glucose (B), glomerular filtration rate (GFR; C) and urine albumin/creatinine ratio (UACR; D) were measured, as described in Methods. Each symbol represents a value from an individual mouse at the end of the 6-month protocol. Histograms represent mean ± SEM, and data were analyzed by 1-way ANOVA and Tukey’s post hoc test for multiple comparisons. (E–H) Representative histology sections from wild-type (E), wild-type + HFD/STZ (F), Slc27a2fl/fl + HFD/STZ (G), and GGT1-Cre+/– Slc27a2fl/fl + HFD/STZ (H) kidney cortex were stained with Masson’s trichrome, as described in Methods. Arrows demarcate proximal tubule cytoplasmic vacuoles. (E-H) Original magnification, ×400.
ER stress is induced by AP proximal tubule palmitate exposure. To screen for pathophysiologically relevant pathways, human proximal tubule cells were grown on permeable supports, which permitted isolated AP and/or BL additions (43). Because circulating palmitate is increased with diabetes (26), and albumin-bound palmitate is filtered in DKD, physiologic and pathologic conditions were modeled by comparison of incubation with BL versus AP + BL palmitate (non-covalently bound to albumin carrier). Bulk RNA-seq was conducted for the following conditions: (a) BL palmitate, (b) AP + BL palmitate, (c) AP palmitate, and (d) AP delipidated albumin control. Kyoto Encyclopedia of Genes and Genomes (KEGG) analysis from AP + BL versus BL palmitate experiments revealed that ER stress represented the most prominent pathway (Supplemental Figure 1; supplemental material available online with this article; https://doi.org/10.1172/jci.insight.199699DS1). Gene set enrichment analyses also revealed high scores for the unfolded protein response (Supplemental Figure 2). The volcano plots in Figure 2 highlight ER stress transcript expression. Importantly, the pattern was almost identical for AP + BL versus BL palmitate (Figure 2A) and AP versus BL palmitate (Figure 2B), indicating that ER stress is driven by AP palmitate uptake. No difference in ER stress transcript expression was noted between AP albumin carrier and BL palmitate groups (Figure 2C), further indicating that AP palmitate is the source of ER stress. Heatmaps show that AP + BL palmitate altered the expression of many ER stress transcripts, most of which were upregulated compared with BL palmitate (Supplemental Figure 3).
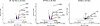 Figure 2
ER stress is induced by AP palmitate exposure. (A) Volcano plot for gene expression resulting from AP + BL versus BL palmitate (100 μM complexed with 0.2% BSA, 16 hours, 37°C), to simulate pathophysiologic conditions, with labeling of multiple upregulated ER stress genes. (B) Volcano plot for gene expression resulting from AP versus BL palmitate (100 μM complexed with 0.2% BSA, 16 hours, 37°C), to determine isolated effects of AP palmitate. (C) Volcano plot for gene expression resulting from AP BSA (0.2%, 16 hours, 37°C) versus BL palmitate (100 μM complexed with 0.2% BSA, 16 hours, 37°C). Gene names and corresponding proteins: ATF4 (activating transcription factor 4), DDIT3 (CCAAT/enhancer-binding protein homologous protein [CHOP]), EIF2A (eukaryotic translation initiation factor 2A), EIF2AK3 (protein kinase R–like endoplasmic reticulum kinase [PERK]), ERN1 (inositol-requiring enzyme 1 [IRE1]), HSPA6 (heat shock protein 70B), PPP1R15A (growth arrest and DNA damage–inducible protein 34 [GADD34]), XBP1 (X-box binding protein 1).
ER stress with in vitro and in vivo models. To test whether the RNA-seq data reflect protein expression, the in vitro palmitate experiments were repeated, and cell lysates were probed for expression of CHOP, which is a downstream effector of ER stress (44). Figure 3, A and B, shows that CHOP was most abundant with AP + BL palmitate but was also detected in the AP-palmitate-only condition. Long-chain FAs are taken up by FATP2, which is exclusively expressed on proximal tubule AP membranes in the kidney (21). AP + BL palmitate–induced CHOP expression was inhibited by the FATP2 inhibitor Lipofermata (MedChemExpress) (45) (Supplemental Figure 4). In vivo, CHOP was abundantly expressed in renal cortex lysates from db/db eNOS–/– mice, which phenocopy DKD, but not in lysates from db/db eNOS–/– mouse kidneys with FATP2 gene deletion (Figure 3, C and D). Taken together, the data support that FA uptake by AP FATP2 stimulates ER stress.
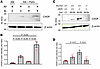 Figure 3
ER stress with in vitro and in vivo models. (A) AP or BL surfaces of human proximal tubule cells on permeable supports were incubated with albumin (0.2%) or albumin (0.2%) complexed with palmitate (100 μM) for 16 hours at 37°C. Lysates were probed for CHOP and β-actin expression by immunoblot analysis, as described in Methods (N = 3 biologically independent samples). (C) Kidney cortex lysates from mice with indicated genotypes were probed for CHOP and β-actin expression by immunoblot analysis, as described in Methods (N = 5 biologically independent samples). Data were quantitated from digitized images using ImageJ software (NIH), shown in histograms as mean ± SEM below representative blots, and analyzed by 1-way ANOVA and Tukey’s post hoc test for multiple comparisons (B and D). Slc27a2, FATP2 gene; eNOS, endothelial nitric oxide gene; Lepr, leptin receptor gene.
AP palmitate causes ER fragmentation. ER stress may be associated with altered ER morphology, including a widened lumen to accommodate chaperone-mediated unfolded protein response, and shortening by reticulophagy to delete dysfunctional ER (30, 46–48). Changes in ER morphology, in response to palmitate, were assessed by measurement of length of tubular ER, the site of lipid synthesis (49). ERs from AP or AP + BL palmitate–treated cells were markedly shorter (Figure 4, A–D), with a mean length of about 200 nm compared with about 700 nm in albumin carrier– and BL palmitate–treated controls (Figure 4E), which is consistent with other reports (50).
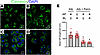 Figure 4
AP palmitate causes ER fragmentation. (A–D) ERs were labeled with calnexin antibodies and nuclei counterstained with DAPI from proximal tubule cells on permeable supports exposed to 0.2% AP albumin carrier (A), BL palmitate (100 μM, 16 hours, 37°C) complexed with 0.2% albumin (B), AP palmitate (100 μM, 16 hours, 37°C) complexed with 0.2% albumin (C), or AP + BL palmitate (100 μM, 16 hours, 37°C) complexed with 0.2% albumin (D). Scale bars: 10 μm. (E) AP or BL surfaces of human proximal tubule cells on permeable supports were incubated with albumin (0.2%) or albumin (0.2%) complexed with palmitate (100 μM) for 16 hours at 37°C. Cells were fixed and labeled for ER with calnexin antibodies as in A–D, and ER length was quantified, as described in Methods. Each symbol represents the mean of multiple ER measurements from a single cell and 3 experiments. Data are mean ± SD. *P < 0.001 compared with BL Alb + Palm group by ANOVA and Tukey’s post hoc test for multiple comparisons.
In vivo and in vitro models are associated with decreased LD biogenesis. The next series of experiments explored the fate of FAs in the context of ER stress initiation. Because palmitate is not well incorporated into triacylglycerol (27–29), and excess intracellular FAs can induce ER stress (29, 51), we tested whether bilateral palmitate affects LD biogenesis. Figure 5A demonstrates LDs in db/db mouse kidney, which accumulate predominantly on the AP side of the proximal tubule. LD density was decreased in proximal tubules from db/db eNOS–/– mice, which phenocopy DKD, and increased in db/db eNOS–/– Slc27a2–/– kidneys (Figure 5B and Supplemental Figure 5). These data are in agreement with conditional Slc27a2–/– mice and inducible DKD (Figure 1H) and support that sequestration of FAs and FA metabolites in LDs protects proximal tubules against cytotoxicity. In vitro, cells exposed to AP + BL palmitate contained fewer LDs compared with cells treated with BL palmitate only (Figure 5C). These data are consistent with decreased expression of transcripts encoding LD biogenesis proteins in the AP + BL palmitate–treated group (Figure 5D). The in vivo and in vitro results indicate that AP FA uptake leads to decreased LD number. Figure 5E demonstrates that blocking LD biogenesis with the diacylglycerol acyltransferase-2 inhibitor PF-06424439, at concentrations that exceed the IC50 = 14 nM (52), but less than the 30 to 50 μM doses used in some studies (29), enhanced ER stress in response to AP + BL palmitate, suggesting that diminished sequestration of FAs and lipotoxic intermediates by LDs precipitates ER stress.
 Figure 5
In vivo and in vitro models are associated with decreased LD biogenesis. (A) Representative kidney cortex section from db/db mouse stained for LDs with LipidSpot, as described in Methods. Original magnification, ×400. (B) Quantification by ImageJ of LDs from kidney cortex of mice (4 non-consecutive sections from 4 mice per genotype). Data are percentage tissue area that contained LDs from an individual mouse and are expressed as mean ± SEM, and were analyzed by 1-way ANOVA and Tukey’s post hoc test for multiple comparisons. (C) BL and/or AP surfaces of human proximal tubule cells on permeable supports were incubated with albumin (0.2%) or albumin (0.2%) complexed with palmitate (100 μM) for 16 hours at 37°C. Cells were fixed, labeled for LDs with LipidSpot as described in Methods, and quantified using ImageJ. Each symbol represents mean LD number in 110 to 289 individual cells per group from 3 separate experiments. Data are expressed as mean ± SD. Data from multiple groups were analyzed by 1-way ANOVA and Tukey’s post hoc test for multiple comparisons. (D) LD biogenesis gene transcript expression in human proximal tubule cells treated with AP + BL versus BL palmitate (100 μM complexed with 0.2% BSA, 16 hours, 37°C). Data are mean ± SD from 3 experiments. P values reflect AP + BL versus BL palmitate comparisons by 2-tailed t test. FPKM, fragments per kilobase transcript per million mapped reads; BSCL2, seipin; FITM2, fat storage–inducing transmembrane protein-2; DGAT, diacylglycerol acyltransferase; PLIN3, perilipin-3; AGPAT1, 1-acyl-sn-glycerol-3-phosphate acyltransferase-α; ACSL5, long-chain acyl-CoA synthetase-5. (E) Human proximal tubule cells were pretreated for 1 hour with the DGAT2 inhibitor PF-06424439 at indicated concentrations, then treated with AP + BL or BL palmitate (100 μM complexed with 0.2% BSA, 16 hours, 37°C), and probed for CHOP or β-actin by immunoblot analysis, as described in Methods (N = 3 biologically independent samples). Immunoblot data were quantitated using ImageJ software and are shown in histograms below representative blots. Data are depicted as mean ± SEM and were analyzed by 1-way ANOVA and Tukey’s post hoc test for multiple comparisons.
Mouse renal cortex ceramide concentrations. Because ceramides are synthesized in the ER and have been implicated in ER stress and DKD (38), we queried whether palmitate exposure leads to altered intracellular ceramide concentrations. C16:0 ceramide was increased in db/db eNOS–/– kidneys and decreased in kidneys from db/db eNOS–/– Slc27a2–/– mice (Figure 6A). There was a decreased C16:0 ceramide trend in conditional proximal tubule Slc27a2–/– mice with inducible DKD (Figure 6B). Interestingly, there was an inverse correlation between C16:0 and unsaturated C18:1 ceramide (Figure 6D), as well as very-long-chain C22:0 ceramide (Figure 6, E and H), which are cytoprotective (53–55). C18:1, C24:0, and C24:1 (Figure 6, C, F, and G) ceramide concentrations are also shown.
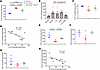 Figure 6
Mouse renal cortex ceramide concentrations. Kidney cortex from mice with the indicated genotypes and exposures was snap-frozen, assayed for ceramides by LC-MS/MS as described in Methods, and normalized to protein content. (A and B) C16:0 ceramide. (C) C18:1 ceramide. (D) Plot illustrating relationship between long-chain ceramides with saturated (C16:0) and monounsaturated acyl chains. (E) C22:0 ceramide. (F) C24:0 ceramide. (G) C24:1 ceramide. (H) Plot illustrating relationship between ceramides with very long (C22:0) and long (C16:0) acyl chains. Data for A–C and E–G are depicted as mean ± SEM and were analyzed by 1-way ANOVA and Tukey’s post hoc test for multiple comparisons. Data from D and H were analyzed by linear regression, and P values indicate that slopes were significantly different. Note different y axis ranges with each ceramide species.
Ceramide concentrations in proximal tubule cells. In vitro, C16:0 ceramide was slightly increased with AP palmitate incubation and more markedly increased with AP + BL palmitate (Figure 7A). As in the in vivo DKD models, reciprocal decreases in C18:1 ceramide and very-long-chain ceramides were also observed under the AP + BL palmitate conditions (Figure 7, B–E). However, the increased C16:0 ceramide concentrations were not accompanied by changes in mRNA expression of ceramide synthesis enzymes (Figure 7F).
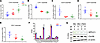 Figure 7
Ceramide concentrations in proximal tubule cells. (A–E) AP and/or BL surfaces of human proximal tubule cells on permeable supports were incubated with palmitate (100 μM complexed with 0.2% BSA, 16 hours, 37°C). Cells were scraped from permeable supports into glass vials, frozen, and assayed for ceramides by LC-MS/MS as described in Methods. Data are expressed as ceramide concentrations normalized to values obtained in cells exposed to albumin (BSA) carrier only. Data for A–E are depicted as mean ± SEM and were analyzed by 1-way ANOVA and Tukey’s post hoc test for multiple comparisons. Blue asterisk, P <0.01 between BL and AP + BL groups by ANOVA. Green asterisk, P <0.01 between AP + BL and other groups by ANOVA. (F) Ceramide synthesis gene transcript expression in human proximal tubule cells treated with AP + BL versus BL palmitate (100 μM complexed with 0.2% BSA, 16 hours, 37°C). Data are mean ± SD from 3 experiments. All P values > 0.05 by 2-tailed t test. FPKM, fragments per kilobase transcript per million mapped reads; SPTLC1, serine palmitoyltransferase long-chain base subunit 1; KDSR, 3-ketodihydrosphingosine reductase; CERS, ceramide synthase; DEGS1, delta 4-desaturase sphingolipid-1; SMPD1, sphingomyelin phosphodiesterase-1; SMPD2, sphingomyelin phosphodiesterase-2; SGPP1, sphingosine-1-phosphate phosphatase-1; DBI, diazepam-binding inhibitor, also known as acyl-CoA–binding protein. (G) Human proximal tubule cells were treated with AP + BL or BL palmitate (100 μM complexed with 0.2% BSA, 16 hours, 37°C) and probed for expression of indicated proteins by immunoblot analysis, as described in Methods (N = 3 biologically independent samples).
Serine palmitoyltransferase (SPT) catalyzes the rate-limiting step in ceramide synthesis by combining palmitoyl-CoA with l-serine to form sphinganine. In a subsequent step, ceramide synthase 5 and ceramide synthase 6 (CerS6) catalyze the formation of C16:0 ceramide synthesis by transfer of palmitoyl-CoA to the sphingoid base. No difference in SPTLC1 subunit or CerS6 protein expression was observed between any of the palmitate incubation conditions (Figure 7G). Figures 6 and 7 indicate that AP palmitate uptake leads to increased C16:0 ceramide accumulation, as a result of enhanced C16:0 FA substrate availability rather than ceramide synthesis enzyme induction. Sphingomyelinases may also contribute to ceramide accumulation, but mRNA expression of acid and neutral sphingomyelinases (SMPD1 and SMPD2), the major sphingomyelinases for C16:0 ceramide generation, was not different in AP + BL versus BL palmitate or BSA carrier conditions (Figure 7F).
Ceramides are a cause and not an effect of ER stress. Ceramides are synthesized in the ER (56) and can be the cause or the effect of ER stress (34, 57–59). ER stress is mediated by 3 pathways, which are initiated by protein kinase R–like ER kinase (PERK), activating transcription factor 6 (ATF6), or inositol-requiring enzyme 1 (IRE1). Of these, the PERK pathway was the most highly upregulated by AP palmitate incubation (Figure 2 and Supplemental Figure 3). To test the effect of ER stress on ceramide concentration, cells were preincubated with the PERK inhibitor AMG PERK44. Supplemental Figure 6 shows that AMG PERK44 inhibited CHOP formation in AP or AP + BL palmitate–incubated cells. Figure 8A shows that AMG PERK44 had no effect on intracellular C16:0 ceramide concentrations, suggesting that ER stress was not the cause of increased ceramides.
 Figure 8
Ceramides are a cause and not an effect of ER stress. (A) Human proximal tubule cells were pretreated with the PERK inhibitor AMG PERK44 (1 μM, 1 hour, 37°C), then treated with AP and/or BL palmitate (100 μM complexed with 0.2% BSA, 16 hours, 37°C). Cells were scraped from permeable supports into glass vials, frozen, and assayed for ceramides by LC-MS/MS as described in Methods. Results are mean ± SEM from 4 experiments. (B) Human proximal tubule cells were pretreated with myriocin (10 μM, 1 hour, 37°C), then with AP and/or BL palmitate (100 μM complexed with 0.2% BSA, 16 hours, 37°C). Cell lysates were probed for CHOP or β-actin by immunoblot analysis, as described in Methods (N = 4 biologically independent samples). (C) Human proximal tubule cells on permeable supports were incubated with Lipofectamine 3000 (LF) with or without C16:0 ceramide (2–4 hours, 37°C in humidified 5% CO2 incubator). Cell lysates were probed for CHOP or β-actin by immunoblot analysis, as described in Methods (N = 3 biologically independent samples). Immunoblot data were quantitated using ImageJ software and are shown in histograms below representative blots. Data are depicted as mean ± SEM and were analyzed by unpaired 2-tailed t test.
C16:0 ceramide causes ER membrane phase transition to a more ordered state. To test whether ceramide incorporation into ER membranes caused ER stress, ceramide synthesis was blocked with the SPT inhibitor myriocin. Supplemental Figure 7A shows dose-dependent myriocin inhibition of C16:0 ceramide formation. Myriocin modestly enhanced LD formation in cells exposed to BL or AP + BL palmitate (Supplemental Figure 7B), suggesting either that the effect was due to incomplete SPT inhibition (Supplemental Figure 7A) or that defective lipid storage only partially explains ceramide toxicity. Figure 8B shows once again that AP + BL > AP >> BL palmitate stimulates ER stress. This effect was inhibited by myriocin, implying that ceramides are a cause rather than an effect of ER stress.
The direct effect of ceramides on ER stress was then tested by Lipofectamine-assisted transfection, which was verified with NBD-labeled C12 ceramide (Supplemental Figure 8, A–D) and liquid chromatography-tandem mass spectrometry (LC-MS/MS) quantification (Supplemental Figure 8E). The increase in Lipofectamine-transduced C16:0 ceramide was associated with ER stress (Figure 8C). Ceramides have been implicated as inducers of ER stress by decreasing ER membrane fluidity, and induced proximity-mediated oligomerization of PERK and IRE1 (39–41). To test for this possibility, AP + BL C16:0 ceramide–loaded cells were stained with C-laurdan, which enables assessment of organellar membrane phase transition (60, 61). Figure 9A demonstrates predominant green C-laurdan fluorescence at baseline, representing relatively fluid organellar membrane domains, whereas introduction of AP + BL C16:0 ceramide caused C-laurdan fluorescence emission to shift from green to blue spectra (Figure 9B), signifying more ordered organellar membranes. Quantitative ER-restricted C-laurdan fluorescence revealed phase transition to relatively more ordered membranes with C16:0 compared with C18:1 ceramide loading (Figure 9, C and D), which reflects decreased ER membrane fluidity from C16:0 ceramide packing.
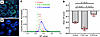 Figure 9
C16:0 ceramide causes ER membrane phase transition to a more ordered state. Human proximal tubule cells on permeable supports were treated with 0.2% albumin carrier (A) or bilateral 10 μM C16:0 ceramide complexed with 0.2% albumin (B) for 16 hours at 37°C. Images show C-laurdan fluorescence of merged green (λ = 490 nm)/blue (λ = 440 nm) wavelength. Original magnification, ×400.(C) To assess ER membrane fluidity, cells on permeable supports were transfected with either C18:1 or C16:0 ceramides, and then colabeled with C-laurdan and ER tracker. C-laurdan fluorescence in colocalized ER was determined by ImageJ (values from 5–13 experiments per condition). Negative generalized polarization (GP) values correspond to the more liquid (disordered) phase, whereas less negative or positive GP values correspond to the more gel-like (ordered) phase. (D) Mean peak GP score ± SEM is shown; data were analyzed by 1-way ANOVA and Tukey’s post hoc test for multiple comparisons.


