
Research ArticleCell biologyMetabolism
Open Access |  10.1172/jci.insight.199981
Impaired adipogenesis and lipid storage capacity in subcutaneous adipose tissue of patients with PMOS
Adeline Divoux,1 Edina Erdos,2,3,4 Katie L. Whytock,1 Timothy F. Osborne,2,3 and Steven R. Smith1,2,3
1Translational Research Institute, AdventHealth, Orlando, Florida, USA.
2Division of Diabetes Endocrinology and Metabolism, Departments of Medicine, Pediatrics, and Physiology Pharmacology, and Therapeutics, Johns Hopkins University School of Medicine, and
3Institute for Fundamental Biomedical Research, Johns Hopkins All Children’s Hospital, St. Petersburg, Florida, USA.
4Institute of Genetics, HUN-REN Biological Research Centre, Szeged, Hungary.
Address correspondence to: Adeline Divoux, 301 E. Princeton St., Translational Research Institute, AdventHealth, Orlando, Florida, 32804, USA. Phone: 407.303.7100; Email: adeline.divoux@adventhealth.com.SRS’s present address is Zealand Pharma A/S, Søborg, Denmark.
Find articles by Divoux, A. in: PubMed | Google Scholar
1Translational Research Institute, AdventHealth, Orlando, Florida, USA.
2Division of Diabetes Endocrinology and Metabolism, Departments of Medicine, Pediatrics, and Physiology Pharmacology, and Therapeutics, Johns Hopkins University School of Medicine, and
3Institute for Fundamental Biomedical Research, Johns Hopkins All Children’s Hospital, St. Petersburg, Florida, USA.
4Institute of Genetics, HUN-REN Biological Research Centre, Szeged, Hungary.
Address correspondence to: Adeline Divoux, 301 E. Princeton St., Translational Research Institute, AdventHealth, Orlando, Florida, 32804, USA. Phone: 407.303.7100; Email: adeline.divoux@adventhealth.com.SRS’s present address is Zealand Pharma A/S, Søborg, Denmark.
Find articles by Erdos, E. in: PubMed | Google Scholar
1Translational Research Institute, AdventHealth, Orlando, Florida, USA.
2Division of Diabetes Endocrinology and Metabolism, Departments of Medicine, Pediatrics, and Physiology Pharmacology, and Therapeutics, Johns Hopkins University School of Medicine, and
3Institute for Fundamental Biomedical Research, Johns Hopkins All Children’s Hospital, St. Petersburg, Florida, USA.
4Institute of Genetics, HUN-REN Biological Research Centre, Szeged, Hungary.
Address correspondence to: Adeline Divoux, 301 E. Princeton St., Translational Research Institute, AdventHealth, Orlando, Florida, 32804, USA. Phone: 407.303.7100; Email: adeline.divoux@adventhealth.com.SRS’s present address is Zealand Pharma A/S, Søborg, Denmark.
Find articles by Whytock, K. in: PubMed | Google Scholar
1Translational Research Institute, AdventHealth, Orlando, Florida, USA.
2Division of Diabetes Endocrinology and Metabolism, Departments of Medicine, Pediatrics, and Physiology Pharmacology, and Therapeutics, Johns Hopkins University School of Medicine, and
3Institute for Fundamental Biomedical Research, Johns Hopkins All Children’s Hospital, St. Petersburg, Florida, USA.
4Institute of Genetics, HUN-REN Biological Research Centre, Szeged, Hungary.
Address correspondence to: Adeline Divoux, 301 E. Princeton St., Translational Research Institute, AdventHealth, Orlando, Florida, 32804, USA. Phone: 407.303.7100; Email: adeline.divoux@adventhealth.com.SRS’s present address is Zealand Pharma A/S, Søborg, Denmark.
Find articles by Osborne, T. in: PubMed | Google Scholar
1Translational Research Institute, AdventHealth, Orlando, Florida, USA.
2Division of Diabetes Endocrinology and Metabolism, Departments of Medicine, Pediatrics, and Physiology Pharmacology, and Therapeutics, Johns Hopkins University School of Medicine, and
3Institute for Fundamental Biomedical Research, Johns Hopkins All Children’s Hospital, St. Petersburg, Florida, USA.
4Institute of Genetics, HUN-REN Biological Research Centre, Szeged, Hungary.
Address correspondence to: Adeline Divoux, 301 E. Princeton St., Translational Research Institute, AdventHealth, Orlando, Florida, 32804, USA. Phone: 407.303.7100; Email: adeline.divoux@adventhealth.com.SRS’s present address is Zealand Pharma A/S, Søborg, Denmark.
Find articles by Smith, S. in: PubMed | Google Scholar
Published August 10, 2026 - More info
JCI Insight. 2026;11(15):e199981. https://doi.org/10.1172/jci.insight.199981.
© 2026 Divoux et al. This work is licensed under the Creative Commons Attribution 4.0 International License. To view a copy of this license, visit http://creativecommons.org/licenses/by/4.0/.
Received: September 5, 2025; Accepted: June 16, 2026


-
Results
Patients with PMOS show signs of IR that correlate with adipocyte size. We recruited 15 women with PMOS and 17 BMI-matched healthy females (CTRL). Figure 1A summarizes the methods used to measure adipose tissue distribution (dual x-ray absorptiometry [DEXA], MRI), glucose tolerance (oral glucose-tolerance test [OGTT]), IR, systemic inflammation, and dyslipidemia. In addition, we deeply interrogated biopsies from ABD and GF-SAT (histology, RNA-seq, single-nuclei RNA-seq and scRNA-seq).
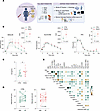 Figure 1
General design of the translational study and clinical characteristics of the 15 CTRL and 17 PMOS women. (A) General design of clinical and adipose tissue phenotyping studies. ABD-AT, s.c. abdominal adipose tissue; GF-AT, gluteofemoral adipose tissue; snRNA-seq, single-nuclei RNA-seq. (B) Insulin; glucose and free fatty acids (FFA) were quantified in serum samples collected during an OGTT test. n = 15 PMOS and 17 CTRL. *P < 0.05 Wilcoxon test between group at specific time point. AUC for each group have been reported as total area under the curve, plotted and compared using an unpaired 2-tailed t test. (C) IL-8 was measured in the serum samples of 15 PMOS and 17 CTRL women. *P < 0.05 unpaired 2-tailed t test. (D) Adipocyte size was determined by microscopy. Average of 100 adipocytes per sample is represented in ABD and GF depot. CTRL group samples are represented in green, and PMOS group samples are represented in pink. *P < 0.05 paired 2-tailed t test. (E) Correlation matrix of relevant clinical parameters and ABD and GF-AT adipocyte size. n = 15 PMOS and 17 CTRL. Only significant correlations (P < 0.05) are represented by a dot; negative correlations are depicted in brown and positive correlations are depicted in green. The size of the dot indicates the R coefficient.
The characteristics of the study groups are presented in Table 1. Although the women with PMOS were slightly younger than the CTRL individuals, all the individuals were relatively young and all were premenopausal. Groups were well matched for ethnicity, general adiposity (BMI, total fat mass, VAT, circulating level of leptin and adiponectin), fat distribution (waist to hip ratio [WHR], android and gynoid fat mass, percentage of leg fat), ectopic fat mass accumulation (liver fat and intramuscular fat), and dyslipidemia (triglycerides, cholesterol/HDL).
Consistent with the literature, the PMOS group showed signs of IR, demonstrated by a trend of higher fasting glucose and HOMA-IR (Table 1), as well as significantly higher testosterone (total and free) and anti-müllerian hormone (AMH) levels as expected. Nine of the 15 patients with PMOS had reported polycystic ovaries at screening as detected by pelvic ultrasound, and irregular menstrual cycles. To directly compare insulin sensitivity between the 2 groups of women, we performed an OGTT (Figure 1B). The glucose level was higher in PMOS compared with CTRL at the beginning and at the end of the OGTT (Figure 1B). Insulin secretion during OGTT challenge was higher in PMOS compared with CTRL (AUC, P = 0.04) and circulating FFA was higher in PMOS (AUC, P = 0.05); the latter suggests a difference in the antilipolytic effect of insulin between both groups which is consistent with earlier work (23). The glucose level was significantly different between 2 groups (AUC, P < 0.01), but not after adjustment with baseline glucose level.
In PMOS, leptin and other cytokines have been hypothesized as local regulators of reproductive function, acting directly on the ovaries (24) and within the brain to stimulate gonadotropin secretion (25). However, when we measured a panel of circulating inflammatory cytokines and chemokines (IL-1b, IL-6, IL-8, IL-10, TNF-α, MCP-1) in the serum of CTRL and PMOS, only IL-8 was increased (Figure 1C) in PMOS, arguing against an alteration in circulating major cytokines playing a role in our PMOS population. The difference of circulating IL-8 was confirmed by ANCOVA after adjustment for age (P = 0.037) or BMI (P = 0.038) and remained of comparable magnitude after adjustment for WHR (P = 0.058) or all 3 covariates jointly (P = 0.051), suggesting an implication of IL-8 in PMOS independent of central obesity. For example, IL-8 can alter follicular development within the ovaries and impact hormone production.
Hypertrophic adipocytes are markers of unhealthy adipose tissue expansion (26, 27), and they have been associated with IR in obesity (28). We determined the average adipocyte diameter on histological section of ABD and GF-AT in both groups (Table 1). GF adipocytes were on average larger than the ABD adipocytes in PMOS, but this was not observed in CTRL (Figure 1D).
A correlation matrix was generated to provide insight into the interrelationships of the lipids/obesity variables with adipocyte size in ABD- and GF-SAT (Figure 1E). In both depots, adipocyte size was positively correlated with adiposity markers (BMI, total fat mass, VAT mass, liver, and intramuscular fat) and diabetes risk markers (glucose, insulin, HgbA1c). Adipocyte size was also negatively correlated with the proportion of lower body fat and circulating levels of the adipokine adiponectin; the latter are markers of metabolically healthy adiposity (29). These results suggest that, in our study, adiposity is associated with larger adipocytes and a greater risk to develop metabolic syndrome (increase of ectopic fat accumulation and diabetes markers). The inverse correlation observed between adipocyte size and fat leg mass (FLM) suggests that women with a gynoid body type (with high FLM) have on average smaller adipocytes than the women with an android body type (characterized by low FLM). Importantly, our study includes a majority of women with an android body type (defined by WHR > 0.8), 19 android versus and 13 women with a gynoid body type (defined by WHR < 0.7), reflecting the fact that PMOS have greater central adiposity than the general population as previously reported (30, 31). Overall, these data suggest the influence of adipose tissue distribution in metabolic syndrome, including in the PMOS group.
Upregulation of genes involved in adipogenesis and fatty acid regulation in all SAT cell types in PMOS compared with CTRL. To identify key cellular composition and transcriptional differences between PMOS and CTRL groups in both ABD and GF-AT, we performed adipose single-nuclei RNA-seq (snRNA-seq). We used ICELL8 Smartseq full length technology, as previously described (32, 33). This study was performed on a subset of the larger population; 5 healthy women (CTRL) and 5 women with PMOS.
In total, 13,633 sequenced nuclei were included in our analysis. After quality filtering, we generated a library of harmony-integrated snRNA-Seq dataset that contained 11,638 single nuclei (5,557 from ABD-SAT and 6,081 from GF-SAT). Unsupervised clustering of the 11,638 nuclei revealed 8 uniquely defined clusters (Figure 2A), as reported previously in SAT using the same technology (icell8) (33). The dotplot Figure 2A shows the relative expression of the marker genes used to identify each cell cluster. The separation of preadipocyte and MSC clusters was made using well-known mesenchymal markers (Figure 2A) and markers highlighted by Strieder-Barboza et al. such as DCLK1; ABCA6, -9, and -10; DCN; LAMA2; ERBB4; THSD4; and PTPRQ (Figure 2B) (34). They also separated the adipose precursors (or ASCs) into 2 distinct subpopulations: the fibro adipogenic ASC (FA-ASC) and the inflammatory mesothelial like ASC (IML-ASC). Interestingly, they also showed adipocytes derived from these separate subpopulations manifest distinct metabolic phenotypes in vitro. In our dataset, based on the gene expression profiles, preadipocytes matched with their IML-ASCs, whereas MSC as defined here matched with their FA-ASCs (Figure 2B).
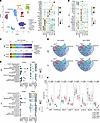 Figure 2
A single nuclei atlas of ABD and GF-AT in women with PMOS and BMI-matched women without PMOS. (A) UMAP projection of clusters formed by 11,638 human single nuclei isolated from ABD and GF-AT. n = 5 PMOS and 5 CTRL. The dotplot shows the marker genes used to identify each cluster. (B) Dotplot representation of relative expression of genes identified by Strieder-Barboza et al. (34) in each cell cluster. FA, Fibro Adipogenic Adipose Stem Cell; IML, Inflammatory Mesothelial like Adipose Stem Cell (34). (C) Stacked bar charts show the repartition of each cluster in CTRL and PMOS samples, split by depot (ABD and GF). (D) Intersection plots show the genes upregulated in CTRL and in PMOS that are common or unique to each cluster (MSC, preadipocytes, adipocytes). The analysis was performed independently in ABD (top graph) and GF-AT (lower graph). (E) Dotplot representation of functional enrichment analysis using Hallmark on the genes differentially regulated between CTRL and PMOS in each cell clusters. Pink indicates the pathways enriched in PMOS samples; green indicates the pathways enriched in CTRL samples. See also Supplemental Figure 1. Overlap represents the number of genes in pathways. (F) Scatter plot showing the proportions of each cell clusters in ABD and GF-AT estimated by deconvolution analysis using RNA-seq data from 17 CTRL women and 15 women with PMOS (including the 10 subjects used for snRNA-seq analysis). See also Supplemental Figure 1.
Interestingly, we identified 2 adipocyte populations that are transcriptionally similar to our previous snRNA-seq dataset of ABD s.c. WAT (33). These 2 adipocyte populations also have similar patterns of expression as 2 populations described in a separate study by Bäckdahl et al. using spatial transcriptomics (35). The authors showed that the adipocyte population expressing higher level of leptin (LEP) and serum amyloid A (SAA) was less insulin sensitive than another adipocyte population that expressed higher perilipin 1 (PLIN1) and also displayed a more robust transcriptional response to insulin. To stay consistent with this published literature, we decided to name the matching populations we identified in our dataset AdipoINS (for adipocyte expressing higher level of genes involved in insulin pathway) and AdipoLEP (for adipocytes expressing higher level of leptin). (Figure 2A). A differential gene expression comparison of AdipoINS versus AdipoLEP revealed, as expected, that the AdipoLEP are enriched for extra cellular matrix (ECM) genes such as DCN, LUM, COL1A1, COL1A2, and MGP as well as inflammatory genes such as C1QC, CXCL14, and APOD (Supplemental Figure 1, B and C; supplemental material available online with this article; https://doi.org/10.1172/jci.insight.199981DS1). To determine if one of these adipocyte populations might be hypertrophic, we evaluated the expression of 46 genes upregulated in adipocytes associated with hyperplasia in AdipoINS and AdipoLEP as identified by Gao et al. to be related to adipocyte morphology (hypertrophy versus hyperplasia) (36). We found that 32 genes (70%) that were elevated in hyperplastic adipose tissue were also upregulated in AdipoINS compared with AdipoLEP. This suggests that AdipoINS adipocytes are connected with hyperplasia rather than hypertrophic adipose tissue expansion (Supplemental Figure 1D).
The overall proportions of each population of cells were not different between adipose tissue depots (Figure 2C) or adipose distribution (Supplemental Figure 1E). Overall, there were no differences in cell-type proportions between CTRL and PMOS groups (Figure 2C).
The 8 gene clusters from the snRNA-seq analysis were then analyzed for genes up- or downregulation in PMOS using differentially genes expression (DEG) analysis between groups (CTRL versus PMOS) within each cluster. We intersected the list of DEG obtained per cluster and found that all the genes differentially expressed in preadipocytes were similarly affected in MSC, suggesting that these 2 populations are related; however, the genes dysregulated in the 2 adipocyte populations were unique to adipocytes, highlighting the difference between them (Figure 2D). Interestingly, we observed an exception to this pattern in the ABD depot where 10% of the genes upregulated in adipocytes from PMOS (AdipoINS and AdipoLEP) were also upregulated in MSC-PMOS (Figure 2D). Pathway analysis with the list of DEG in each cluster revealed that genes related to adipogenesis, fatty acid metabolism, and oxidative phosphorylation were uniquely upregulated in PMOS preadipocytes, adipoINS, and vascular cells (Figure 2E). These results were consistent in both depots. Additional pathways related to cell proliferation (Myc Target V1, Mtorc1) were upregulated only in clusters from PMOS GF depot (Figure 2E).
Next, to assess if the proportion of the 8 cell clusters identified by snRNA-seq (Figure 2A) differed between PMOS and CTRL in the larger group of 17 CTRL and 15 PMOS, we utilized our dataset as a reference to estimate cell-type proportions in bulk-RNA sequencing data obtained from the ABD and GF-SAT using our optimized deconvolution pipeline (37). This analysis revealed that the relative abundance of MSC, preadipocyte, and AdipoLEP are higher in PMOS compared with CTRL in both ABD and GF-SAT depots (Figure 2F). In contrast, we observed a decrease in the relative abundance of AdipoINS and vascular cells in the PMOS samples (Figure 2F). We also observed a decrease of the relative proportion of mast cells in both SAT depots in PMOS and an increase in the myeloid and lymphoid populations in both depots (Figure 2F).
Testosterone level is negatively associated with healthy adipose tissue expansion. To investigate the influence of sex hormones on the metabolic phenotype of the individuals, we analyzed the relationship between the level of testosterone (free and bioavailable), sex hormone binding globulin (SHBG), anti-mullerian hormone (AMH), and luteinizing hormone and Follicle-stimulating hormone ratio (LH:FSH) as well as the clinical data. Only the levels of androgen hormones were correlated with these clinical traits (Supplemental Figure 2A). To further investigate the role of testosterone on SAT gene expression and cell composition, we performed RNA-seq on snap-frozen biopsies of ABD and GF adipose tissue. We first weighted gene coexpression network analysis (WGCNA) using adiposity markers and systemic testosterone level as variables. This analysis revealed 21 and 20 coexpression networks in ABD and GF-SAT, respectively (Figure 3A). One gene expression network (or module labeled ME on Figure 3A) in each depot (MEturquoise in ABD and MEblue in GF) was significantly positively correlated with testosterone, total fat mass, VAT mass, liver, and intramuscular fat accumulation and negatively correlated with the percentage of leg fat mass (LFM) (Figure 3A). These 2 networks have 755 common genes, representing around 40% of the total genes included in the individual network. Pathway and transcription factor analysis of these common genes identified “Adipogenesis” and “Oxidative phosphorylation” as the top differentially regulated pathways (Figure 3B). The transcription factors identified as targeting these genes are previously known as critical transcription factors controlling adipogenesis (PPARG) and fatty acid/cholesterol biosynthesis (SREBF1). These results demonstrate that testosterone is associated with the transcriptional regulation of adipogenic genes in both ABD and GF depots and suggest that it is responsible for excess fat accumulation. The pathway analysis generated from the unique genes in each network are reported in Supplemental Figure 2B. We highlight “adipogenesis” is present only in the GF network, suggesting that genes involved in adipogenesis and that participate in whole-body fat accumulation only have an effect in the GF depot. The correlations of each gene expression with key clinical parameters are shown in Supplemental Table 1. This negative correlation suggests that testosterone is associated with a reduction of healthy adipose tissue expansion (negative correlation with tissue vascularization and insulin sensitive adipocytes).
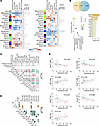 Figure 3
Association between testosterone level and SAT gene expression and cell population proportion in ABD and GF-AT. (A) Heatmaps representation of the correlations between the gene modules identified by WGCNA analysis and relevant clinical parameters in ABD and GF-AT. (B) Intersection plot showing the number of common genes between the turquoise module (in ABD-AT) and the blue module (in GF-AT). Pathway analysis reveals transcription factor (TRRUST) and pathways enriched in these common genes. EMT, Epithelial Mesenchymal Transition. (C) Correlation matrix of cell proportions and testosterone (total, free and bioavailable) and SHBG level. Only significant correlations (P < 0.05) are represented by a dot; negative correlations are depicted in green and positive correlations are depicted in pink. The size of the dot indicates the R coefficient. (D) Spearman correlation plots between total testosterone and relevant cell clusters in ABD and GF-AT depot, in combined group. PMOS participants are represented in pink; CTRL participants are represented in green. See also Supplemental Figure 2. (E) Correlation matrix of ectopic fat accumulation markers and adipogenesis-related genes in ABD and GF-SAT depot. Only significant correlations (P < 0.05) are represented by a dot; negative correlations are depicted in brown, and positive correlations are depicted in green. The size of the dot indicates the R coefficient.
Next, we analyzed at the associations between the clinical parameters, specifically testosterone level, and the relative proportion of each cell cluster in the snRNA-seq data set (Figure 2B). The correlation matrix revealed a positive correlation between the level of T (total and free) and the relative proportion of precursor cells (MSC and preadipocytes) in both depots and only in ABD depot a positive correlation between T and the relative proportion of AdipoLEP. Interestingly, an inverse correlation was observed between T level (total) and the relative proportion of AdipoINS and vascular cells in both depots (Figure 3C). Figure 3D shows the individual correlations used for generating the correlation matrix in Figure 3C between T-Total and cell proportions. The correlation matrices generated in only ABD and only GF-SAT are reported in Supplemental Figure 2C. Interestingly, the expression of androgen footprint gene set (AKR1C1, AKR1C2, AKR1C3, CYP19A1, HSD17B1) is higher in adipoLEP compared with adipoINS (Supplemental Figure 2D). AdipoLEP proportion is higher in PMOS versus CTRL. These observations suggest that adipoLEP in PMOS are actively processing androgen, potentially participating in the local effect of androgen on adipose tissue.
In both depots, we found that the relative proportion of AdipoINS to vascular cells was negatively associated with total adiposity markers (BMI, total fat mass) and central obesity markers (WHR, VAT mass, liver fat) (Supplemental Figure 2C). These data suggest that, locally, AdipoINS and the vascular compartments play a protective role to limit central adiposity and ectopic fat accumulation, potentially by favoring vascularization along with healthy SAT expansion in both SAT depots. This is consistent with the expandability hypothesis (38).
To validate the hypothesis that testosterone limits the expansion of SAT in PMOS, leading to the ectopic accumulation of fat, we explored the relationship between the expression of adipogenesis related genes in the ABD and GF-SAT against TG level, VAT mass, liver fat, IML, and WHR (39). In alignment with our earlier findings, we found negative correlations between the expression of the master regulator of adipogenesis, PPARG, in ABD and GF-SAT with VAT mass and liver fat accumulation (Figure 3E).
DEG pseudotime analysis suggests a block to differentiation in PMOS preadipocytes. Next, we leveraged the use of previously validated pseudotime trajectory analyses and RNA velocity in silico. Pseudotime analysis reveals the interactions of cells through commitment, differentiation, and maturation along developmental pathways. We used this method to track adipocyte differentiation from the 2 precursor populations (MSC and preadipocytes) into the 2 adipocyte populations comparing the results between the CTRL and PMOS groups.
Surprisingly, the pseudotime trajectory initiated in the preadipocyte cluster and not at the MSC cluster. The model predicted a split into 2 branches: one continued into the AdipoLEP cluster, while the other one continued toward the AdipoINS cluster (Figure 4A) in both clinical groups (Figure 4A). The quantification of cells according to their position in the projected pseudotime pathway indicates that preadipocytes in the PMOS group accumulate in the middle of the pseudotime pattern as compared with CTRL (Figure 4B). This result is consistent with a block in adipocyte differentiation in the PMOS preadipocytes.
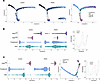 Figure 4
Pseudotime analysis suggests block of differentiation in PMOS. (A) Distinct state of cells identified by pseudotime analysis in CTRL and in patients with PMOS using MSC, preadipocytes, AdipoLEP, and AdipoINS. (B) Ordering and quantification of cells from different clusters identified in A along the pseudotime trajectory and according to the condition (CTRL or PMOS). (C) Distinct state of cells identified by pseudotime analysis in CTRL and in patients with PMOS using MSC, preadipocytes and AdipoINS only.
When we reanalyzed the dataset using only the MSC, preadipocytes, and AdipoINS, we obtained similar results (Figure 4C), with a trajectory initiated in preadipocytes rather than in MSC and accumulation of preadipocytes in the middle of the pseudotime pathway only in the PMOS group. These distinct patterns and differences between CTRL and PMOS suggest that the MSC and preadipocytes likely represent 2 distinct precursor cell types and are not part of a continuum. Also, comparison of PMOS to CTRLs suggest that preadipocytes but not MSC fail to differentiate fully into AdipoINS adipocytes in PMOS.
Accumulation of MSC in the SVF of patients with PMOS. The frozen tissue snRNA-seq analysis suggested a potentially novel hypothesis for metabolic dysregulation in PMOS — specifically, a block in precursor differentiation into mature adipocytes. To further test this hypothesis, we performed scRNA-seq on freshly isolated SVF from ABD and GF adipose tissue in n = 4 individuals with PMOS and n = 5 CTRL from our original larger cohort. A total of 7,204 sequenced cells were included in our analysis. We identified 7 clusters and as above we named them according to the relative expression of the known markers of MSC, preadipocytes, vascular, lymphoid, and myeloid cells (Figure 5A). The marker genes used are reported in the dotplot in Figure 5A. Additional marker genes of MSC are shown in Supplemental Figure 3B, demonstrating a clear distinction between MSC and preadipocytes, where expression of stem cell marker genes is absent in the preadipocytes. We found a similar distinction between the MSC and preadipocyte fractions, which we have previously identified in our snRNA-seq dataset, notably the MSC cluster appears to be more fibro-adipogenic (Supplemental Figure 3C). We also observed that the preadipocytes were mainly in the S and G2M phases of the cell cycle, in both depots, indicative of their highly proliferative state (Supplemental Figure 3D).
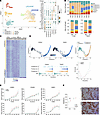 Figure 5
A single-cell ATLAS of ABD and GF-stroma vascular fraction in women with PMOS and BMI-matched CTRL. (A) UMAP projection of clusters formed by 7,204 human single cells extracted from ABD and GF-SVF. n = 5 CTRL and 4 PMOS. The dotplot shows the marker genes used to identify each cluster. (B) Stacked bar plots showing the proportion of each cluster per subject and their average per group (CTRL versus PMOS) and per depot (ABD versus GF). (C) Heatmap showing the expression of the most DEG between the 3 populations of preadipocytes in each cell (Only Pread-1, Pread-2, and Pread-3 being included on the heatmap). (D) Distinct state of cells identified by pseudotime analysis in CTRL and in patients with PMOS. Ordering and quantification of cells from different clusters identified in A along the pseudotime trajectory and according to the condition (CTRL or PMOS). (E) Gene expression level during 12-days of adipogenic differentiation of ABD-MSC isolated from CTRL-SVF (n = 5) and PMOS-SVF (n = 5). (F) The degree of differentiation was measured by Oil red O in each group after 12 days (D12) and 16 days (D16) of differentiation. A representative picture of cells isolated from CTRL-SVF and from PMOS-SVF after 12 days of differentiation is shown. See also Supplemental Figures 3 and 4. Original magnification, ×20. *P < 0.05 Mann Whitney test between group.
We next quantified the relative cell proportion in the SVF of each depot and in each group. In PMOS, the relative proportion of MSC was higher, whereas the relative proportion of preadipocyte populations was lower (Figure 5B). Importantly a unique preadipocyte population was identified in PMOS, preadipocyte 3; however, very few cells were identified in this cluster (Figure 5B). DEG analysis between the 3 preadipocyte populations revealed that the third preadipocyte cluster enriched in PMOS displayed a unique transcriptome with higher expression of inflammatory genes compared with the 2 other preadipocyte populations (Figure 5C and Supplemental Figure 3E). Further pathway analysis of the unique genes in each preadipocyte cluster showed that 1 cluster of preadipocytes upregulated in PMOS group (Preadipocyte 2) expressed higher levels of genes encoding extracellular matrix proteins including ECM glycoproteins, collagens, and proteoglycans (Supplemental Figure 3F). Preadipocyte 1 cluster (up in CTRL group) showed an increase of genes involved in adipogenesis (FTL, CXCL14, FABP4, CFD) and in G2M checkpoint genes, for example TERT (Supplemental Figure 3G). This signature suggests chromosomal stability by maintaining telomere length allowing cells to avert senescence. Taken together, these gene expression patterns is consistent with preadipocytes in the CTRL group that are highly proliferative and have a higher adipogenic capacity than the preadipocytes in PMOS; the latter being more fibrotic and proinflammatory.
To test if the 3 preadipocyte populations and MSC are part of a continuum, we included them in a second pseudotime trajectory analysis. This revealed the expected continuous gene regulatory program starting with MSCs and finishing at the preadipocyte lineage (Figure 5D). This is consistent with our earlier observations in full SAT tissue where there is an accumulation of preadipocyte 1 cells in the PMOS group. These cells are in the middle of the pseudotime pathway (indicated by an arrow of Figure 4D). We interpret this finding as consistent with the lack of capacity to differentiate along the continuum. More importantly, a larger peak of cells at the end of the pseudotime in CTRL versus PMOS is consistent with more cells engaged in terminal adipogenesis in CTRL as compared with PMOS.
To further evaluate the potential block in differentiation in PMOS more directly, we compared the level of differentiation of the progenitors from PMOS versus CTRL in vitro using ADSC cultured over several days. As shown by Oil red O quantification and the level of expression of expression of adipogenic marker genes at the beginning of the differentiation (CEBPA and PLIN1), the PMOS cells differentiated more than the CTRL (Figure 5E for ABD depot and Supplemental Figure 4 for GF depot). The difference was not maintained when the cells were allowed to continue to differentiate for 16 days instead of 12 days (Figure 5F). To summarize, PMOS SVF contains more MSC than the CTRL-SVF and these MSC are more adipogenic.
SLIT2 secretion is increased in MSC in PMOS and could block preadipocyte differentiation via its interaction with ROBO1/2. We hypothesized that, even though their proportion is higher, the MSC population observed in PMOS might not differentiate properly due to an inhibitory microenvironment in vivo. One possible inhibitor could be testosterone itself because it is elevated in PMOS. Thus, we first tested this hypothesis during human adipogenesis by adding testosterone continuously into the differentiation media of cultured MSC. Consistent with a prior published report (40, 41), the addition of T resulted in a decrease in MSC differentiation from both depots of CTRL and PMOS (Figure 6A). These results suggest that endocrine signal(s) like testosterone might reduce the capacity for differentiation of APCs in PMOS in vivo. To search for additional potential paracrine pathways that might operate between MSC and preadipocytes in PMOS and CTRL, we went back to the results of our CellChat analysis of our scRNA-seq dataset. This analysis highlighted a large number of putative secreted signals (Figure 6B) and ECM-receptor signals (Figure 6C) originating from MSC that connect to preadipocytes 1 and 2 that were predicted to occur in PMOS but were not observed in CTRL.
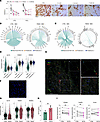 Figure 6
Potential interaction between MSC and Preadipocytes via SLIT2/ROBO pathway. (A) Level of differentiation of ABD-ADSCs after 12 days of incubation of adipogenic differentiation cocktail supplemented with testosterone (T). Oil red O was used to quantify the lipid accumulation at day 12. n = 10 ADSCs, isolated from 5 CTRL and 5 PMOS. Representative pictures of CTRL ADSCs at D12 of differentiation with or without testosterone in the media. Scale bars: 200 μm. (B) Circle plots of secreted signaling pathways coming from MSC population enriched in CTRL and in PMOS group. The colors of the circle specify which cell type receives the signal. (C) Circle plots of ECM-receptor signaling pathways enriched in MSC CTRL and in MSC PMOS group. The colors of the circle specify which cell type receives the signal. (D) Violin plots comparing the expression level of SLIT2, ROBO1, and ROBO2 in MSC, Pread-1, and Pread-2 nuclei between CTRL and PMOS group. (E) Immunofluorescence staining of s.c. adipose tissue using WGA (488 excitation length of the fluorochrome) and ROBO1 (647 excitation length of the fluorochrome) antibodies. Hoescht was used to stain the nuclei. Scale bar: 200 μm. (F) Immunofluorescence staining of stroma vascular fraction cells using ZNF423 (488 excitation length of the fluorochrome) and ROBO1 (647 excitation length of the fluorochrome) antibodies. Hoescht was used to stain the nuclei. Original magnification, ×20. (G) Violin plots comparing the expression level of SLIT2, ROBO1, and ROBO2 in scRNA-seq dataset. (H) Histogram of SLIT2 secretion in 24-hour-condition media of MSC isolated from CTRL (n = 5) and from PMOS (n = 5). **P < 0.05 by Mann-Whitney U test. (I) Expression of PPARG, CEBPA, and PLIN1 in cells treated with SLIT2 one day before the beginning of differentiation and during 4 days of differentiation. Cells were collected at day 4, RNA was extracted, and gene expressions determined by qPCR. See also Supplemental Figure 5. **P < 0.01 by Wilcoxon matched-pairs signed rank test.
The number of secreted signals originating in preadipocyte 1 was also higher in the PMOS group (Supplemental Figure 5A). Of these signaling pairs, SLIT2/ROBO1/2 was predicted as the strongest pathway between MSC and preadipocytes in PMOS (Figure 6C). Interestingly, the expression of SLIT2 was higher in MSC and expression of ROBO1 and ROBO2, the cognate receptors for SLIT1/2, were higher in preadipocytes (Figure 6D and Supplemental Figure 5B). We confirmed that preadipocytes expressed ROBO1 protein at their surface by costaining SVF cells with ZNF423 (marker of committed preadipocytes) and ROBO1 (Figure 6, E and F, and Supplemental Figure 5C). We also confirmed that ROBO1 protein was expressed in adipocytes (Supplemental Figure 5D). The level of expression of SLIT2 and ROBO1/2 mRNAs were similar between CTRL and PMOS, both in our scRNA-seq data set (Figure 6G) and during differentiation (Supplemental Figure 5E). Importantly, MSC isolated from PMOS ABD biopsies secreted greater level of SLIT2 protein compared with MSC isolated from CTRL ABD biopsies (Figure 6H, 24-hour secretion) and the expression of SLIT2 decreased sharply after initiation of differentiation in both CTRL and PMOS cells (Supplemental Figure 5E). To determine the relevance of these results, we added SLIT2 early during in vitro differentiation (between day –2 and day 4) and found that SLIT2 recombinant protein reduced the expression of key adipogenic genes (CEPBA, PPARG, PLIN1; Figure 6I). Altogether, these data reveal that SLIT2 secreted by MSC might reduce the adipogenic capacity of neighboring preadipocytes within SAT. Because there is a higher proportion of MSC in PMOS and there is a higher level of secretion of SLIT2 by MSC from PMOS, this pathway may explain the observed “block” in adipocyte differentiation and differences in mature adipocyte populations in PMOS.


