
Research ArticleInfectious diseasePulmonology
Open Access |  10.1172/jci.insight.201739
Early cell-autonomous and niche-mediated epithelial response to influenza infection in primary alveolar organoids
Amber Elitz,1,2,3,4 Sharlene Fernandes,3,4 Kathleen C.S. Cook,3,4 Helen I. Warheit-Niemi,3,4 Barbara Zhao,1,2,3,4 Andrea Toth,1,2,3,4 Amanda L. Zacharias,3,4,5,6,7 and William J. Zacharias3,4,5,6,7
1Medical Scientist Training Program,
2Development, Stem Cells, and Regenerative Medicine Graduate Training Program,
3Perinatal Institute,
4Division of Pulmonary Biology,
5Department of Pediatrics,
6Division of Pulmonary, Critical Care and Sleep Medicine, and
7Department of Internal Medicine, University of Cincinnati College of Medicine, Cincinnati, Ohio, USA.
Address correspondence to: William J. Zacharias, 3333 Burnet Avenue, MLC 7009, Cincinnati, Ohio 45229, USA. Phone: 513.626.2938; Email: william.zacharias@cchmc.org.
Find articles by Elitz, A. in: PubMed | Google Scholar
1Medical Scientist Training Program,
2Development, Stem Cells, and Regenerative Medicine Graduate Training Program,
3Perinatal Institute,
4Division of Pulmonary Biology,
5Department of Pediatrics,
6Division of Pulmonary, Critical Care and Sleep Medicine, and
7Department of Internal Medicine, University of Cincinnati College of Medicine, Cincinnati, Ohio, USA.
Address correspondence to: William J. Zacharias, 3333 Burnet Avenue, MLC 7009, Cincinnati, Ohio 45229, USA. Phone: 513.626.2938; Email: william.zacharias@cchmc.org.
Find articles by Fernandes, S. in: PubMed | Google Scholar
1Medical Scientist Training Program,
2Development, Stem Cells, and Regenerative Medicine Graduate Training Program,
3Perinatal Institute,
4Division of Pulmonary Biology,
5Department of Pediatrics,
6Division of Pulmonary, Critical Care and Sleep Medicine, and
7Department of Internal Medicine, University of Cincinnati College of Medicine, Cincinnati, Ohio, USA.
Address correspondence to: William J. Zacharias, 3333 Burnet Avenue, MLC 7009, Cincinnati, Ohio 45229, USA. Phone: 513.626.2938; Email: william.zacharias@cchmc.org.
Find articles by Cook, K. in: PubMed | Google Scholar
1Medical Scientist Training Program,
2Development, Stem Cells, and Regenerative Medicine Graduate Training Program,
3Perinatal Institute,
4Division of Pulmonary Biology,
5Department of Pediatrics,
6Division of Pulmonary, Critical Care and Sleep Medicine, and
7Department of Internal Medicine, University of Cincinnati College of Medicine, Cincinnati, Ohio, USA.
Address correspondence to: William J. Zacharias, 3333 Burnet Avenue, MLC 7009, Cincinnati, Ohio 45229, USA. Phone: 513.626.2938; Email: william.zacharias@cchmc.org.
Find articles by Warheit-Niemi, H. in: PubMed | Google Scholar
1Medical Scientist Training Program,
2Development, Stem Cells, and Regenerative Medicine Graduate Training Program,
3Perinatal Institute,
4Division of Pulmonary Biology,
5Department of Pediatrics,
6Division of Pulmonary, Critical Care and Sleep Medicine, and
7Department of Internal Medicine, University of Cincinnati College of Medicine, Cincinnati, Ohio, USA.
Address correspondence to: William J. Zacharias, 3333 Burnet Avenue, MLC 7009, Cincinnati, Ohio 45229, USA. Phone: 513.626.2938; Email: william.zacharias@cchmc.org.
Find articles by Zhao, B. in: PubMed | Google Scholar
1Medical Scientist Training Program,
2Development, Stem Cells, and Regenerative Medicine Graduate Training Program,
3Perinatal Institute,
4Division of Pulmonary Biology,
5Department of Pediatrics,
6Division of Pulmonary, Critical Care and Sleep Medicine, and
7Department of Internal Medicine, University of Cincinnati College of Medicine, Cincinnati, Ohio, USA.
Address correspondence to: William J. Zacharias, 3333 Burnet Avenue, MLC 7009, Cincinnati, Ohio 45229, USA. Phone: 513.626.2938; Email: william.zacharias@cchmc.org.
Find articles by Toth, A. in: PubMed | Google Scholar
1Medical Scientist Training Program,
2Development, Stem Cells, and Regenerative Medicine Graduate Training Program,
3Perinatal Institute,
4Division of Pulmonary Biology,
5Department of Pediatrics,
6Division of Pulmonary, Critical Care and Sleep Medicine, and
7Department of Internal Medicine, University of Cincinnati College of Medicine, Cincinnati, Ohio, USA.
Address correspondence to: William J. Zacharias, 3333 Burnet Avenue, MLC 7009, Cincinnati, Ohio 45229, USA. Phone: 513.626.2938; Email: william.zacharias@cchmc.org.
Find articles by Zacharias, A. in: PubMed | Google Scholar
1Medical Scientist Training Program,
2Development, Stem Cells, and Regenerative Medicine Graduate Training Program,
3Perinatal Institute,
4Division of Pulmonary Biology,
5Department of Pediatrics,
6Division of Pulmonary, Critical Care and Sleep Medicine, and
7Department of Internal Medicine, University of Cincinnati College of Medicine, Cincinnati, Ohio, USA.
Address correspondence to: William J. Zacharias, 3333 Burnet Avenue, MLC 7009, Cincinnati, Ohio 45229, USA. Phone: 513.626.2938; Email: william.zacharias@cchmc.org.
Find articles by Zacharias, W. in: PubMed | Google Scholar
Published July 2, 2026 - More info
JCI Insight. 2026;11(15):e201739. https://doi.org/10.1172/jci.insight.201739.
© 2026 Elitz et al. This work is licensed under the Creative Commons Attribution 4.0 International License. To view a copy of this license, visit http://creativecommons.org/licenses/by/4.0/.

-
Results
Optimizing influenza infection in complex AEOs. To model IAV infection in AEOs, we generated AEOs by sorting primary AT2 progenitor cells from adult mice and combining with expanded primary mesenchyme in Matrigel and small airway epithelial cell growth medium (SAGM), as previously described (24). After culturing AEOs for 21–28 days, we attempted infection in AEOs still within the Matrigel plug by adding H1N1 PR8 IAV at a multiplicity of infection (MOI) of 10 (1.025 × 10⁶ PFU) to the top of each well in spiked SAGM (see Methods). We observed that few cells were infected and expressing IAV nucleoprotein (NP) 24 hours post infection (hpi) (Figure 1A), suggesting that viral diffusion through the Matrigel was too inefficient for robust AEO cell infection. This has been overcome in previous studies by using cultures with thin layers of matrix (25, 26) or by applying the infection to organoids or cells in suspension (27–29). To improve infection kinetics in our AEOs, we removed the mature ones from the matrix and transitioned the isolated AEOs to suspension culture in SAGM. We evaluated protein expression of AGER and surfactant protein C (SPC) to detect AT1 and AT2 cells, respectively. Transition to suspension minimally disrupted AEO cell number and cavity integrity within the first 24 hours, with a general loss of AT1 cells and a substantial loss of cell number per AEO by 36 hours (Figure 1, B and C). We therefore chose to restrict our evaluation to the first 24 hours of suspension culture. This had the advantage of focusing our analysis on early impact of IAV.
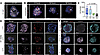 Figure 1
Optimization of influenza A (IAV) infection conditions for alveolar organoids (AEOs). (A) Treatment of AEOs with IAV in media placed on apical surface of Transwell above Matrigel plug. Minimal NP expression is evident at 24 hpi. (B) Morphology of AEOs in suspension culture after liberation from Matrigel. AT1 and AT2 cell morphology is maintained for 24 hours after suspension but has decreased by 36 hours. (C) Cell number per organoid in suspension culture. We noted a substantial loss of cell number by 36 hours after liberation. (D) Cell state of AEOs with infection of IAV using SAGM base with TPCK-treated trypsin and lacking serum (Inf. media). Suspension in this medium allowed flu infection by 8 hours (NP) but led to loss of AT1 cells (AGER) without loss of AT2 cells (SPC). (E) Impact of different media compositions on cell junctions in AEOs. Infection media (top row) led to loss of AGER and associated loss of ZO-1–marked cell surface tight junctions. Removal of TPCK-treated trypsin or addition of 5% serum prevented these changes. Scale bars: 50 μm. SPC, surfactant protein C (AT2 marker); AGER, advance glycosylation end-product–specific receptor (AT1 marker); NP, IAV nucleoprotein (infected cell marker); ZO-1, zonula occludens-1 (cell surface tight junction marker).
We next sought to optimize our AEO infection media conditions. Published protocols in monolayer culture and lung spheroids have demonstrated that L-1-tosylamide-2-phenylethyl chloromethyl ketone–treated (TPCK-treated) trypsin cleaves influenza entry factor HA0 to expose the viral particle binding sites and facilitates infection initiation in cell lines lacking key transmembrane proteases (30). The addition of serum to infection media for IAV has been suggested to impede viral infection, likely by quenching trypsin activity (30). We therefore evaluated an “infection media” that was both serum-free and contained TPCK-treated trypsin. We found that AEOs, particularly the AT1 population, were extremely sensitive to disturbances in mechanical tension induced by trypsin. While the AEOs retain AT1 structure and specification in suspension (Figure 1B), the addition of TPCK-treated trypsin cleaved cell-cell junctions and produced a selective loss of AT1 cells followed by general organoid degradation within 8 hours (Figure 1D). Removal of trypsin from the media or addition of 5% serum for neutralization protected AT1 morphology in AEOs (Figure 1E). We therefore decided to proceed with infection modeling in suspension culture using complete SAGM containing serum.
Infection dynamics and cellular specificity of IAV in vitro in AEOs. Using our optimized infection conditions, we performed an infection time series in AEOs in SAGM suspension (Figure 2A) at 4, 8, 12, and 24 hpi, and followed infection kinetics by whole-mount IHC to detect (Figure 2B) and quantify (Figure 2, C and D) NP-positive nuclei. We reasoned that by 24 hpi, host cells have undergone a full viral life cycle, with the majority of infected cells experiencing a period of continuous viral replication (31), suggesting that key changes in early IAV pathogenesis would likely be captured by this time point. The percentage of NP+ cells per AEO progressed from less than 10% at 4 hpi to 24% at 8 hpi, 29% at 12 hpi, and more than 40% at 24 hpi (Figure 2C). These results suggest that cells expanded in primary AEO culture retained sufficient expression of key transmembrane proteases that perform the HA cleavage to enable viral binding in the absence of TPCK-treated trypsin. Furthermore, these kinetics indicate sufficient rates of infection for downstream analysis, without the additional stress on the cells of re-embedding in matrix for a longer incubation. This is a critical distinction from some previously published infection models in which organoid shearing/breaking was optimal for organoid infectivity (32–34). IHC demonstrated infection primarily in AT2 cells when corrected for population size (Figure 2D). To assess viral binding availability, we performed staining with the lectin Sambucus nigra agglutinin (SNA) to evaluate the presence of the primary IAV binding moiety, α-2,6-sialic acid (Supplemental Figure 1A; supplemental material available online with this article; https://doi.org/10.1172/jci.insight.201739DS1). AT2 cells demonstrated increased SNA labeling compared with AT1 in AEOs. This distribution was maintained following a 24-hour suspension with no noteworthy changes to α-2,6-sialic acid polarity on the AT2s (Supplemental Figure 1B). To assess α-2,6-sialic acid expression in AT2 and AT1 cells in vivo, we performed flow cytometry from freshly isolated epithelium from wild-type mice (Supplemental Figure 2, A and B). To confirm this specificity in cell infectivity in vivo, infected R26R-EYFP mice with a PR8 strain harboring Cre and evaluated YFP expression per cell type by flow cytometry (Supplemental Figure 2A). We confirmed more expression of SNA in AT2 cells in vivo (Supplemental Figure 2C) and found more infected AT2 cells than AT1 at 72 hpi in vivo (Supplemental Figure 2D). Taken together, these data demonstrated a clear progression of IAV infection in AEOs across the 24 hours in suspension, which replicated the cellular targeting of IAV in the lung in vivo.
 Figure 2
Temporal dynamics and cellular specificity of IAV infection in AEOs. (A) Schematic of method for liberation and treatment of AEOs with IAV. (B) AEOs treated with H1N1 develop progressively increased influenza infection as measured by nuclear expression of H1N1 NP across 24 hpi. (C) Quantification of NP+ nuclei at each time point of infection. (D) Cell-type-specific infection in AEOs. More AT2 cells are infected than AT1 by 8 hpi and thereafter. Scale bars: 50 μm. SPC, surfactant protein C (AT2 marker); AGER, advance glycosylation end-product–specific receptor (AT1 marker); NP, IAV nucleoprotein (infected cell marker); SNA, Sambuccus nigra agglutinin (flu binding motif α-2,6-sialic acid). *P < 0.05; **P < 0.01; **P < 0.001; ****P < 0.0001 by ANOVA with prespecified multiple comparisons; 1-way ANOVA (C); 2-way ANOVA (D).
Defining trajectories of cellular injury in IAV AEOs with multiome sequencing. To evaluate changes in gene expression and chromatin accessibility in infected AEOs, we performed multiomic snRNA-seq and snATAC-seq on nuclei isolated from AEOs suspended in SAGM with or without H1N1 at 8, 16, and 24 hpi. The multiome assay generated linked RNA and ATAC data at per-nucleus resolution, allowing us to assess both gene transcript expression and chromatin accessibility per cell. To identify infected cells, we generated a custom mm10 (35, 36) genome alignment file that included the PR8 viral genome to allow detection of cells with active viral replication occurring in the nucleus. After filtering to remove doublets (37) and ambient RNA (38), we recovered 33,926 single-nucleus transcriptomes with a range of 3,642 to 8,793 cells per time point and condition, with a median of 943 unique molecular identifiers (UMIs) (interquartile range 614–1,712) per cell, and a median of 734 genes (interquartile range 509–1,186) per cell. These snRNA-seq depths were below those previously observed with single-cell RNA-seq (scRNA-seq) in AEOs (24) or in vivo after flu infection (21, 39), but provided resolution to define infected cells and simultaneously compare transcriptome and epigenome state. We focused our analysis on major cell states defined by nearest neighbor analysis using both snRNA-seq and snATAC-seq assays.
Following unbiased clustering (Figure 3A), we identified AT2 cells, as well as a population of AT1 and AT1-like (AT1tr) cells within the epithelium, as expected based on our IHC results (Figure 3B). We also detected the anticipated mesenchymal/feeder cell population, including mouse lung fibroblasts and some myeloid cells that persist in the feeder culture but do not alter infection kinetics (Supplemental Figure 3, A–C). These cells were identified by marker gene analysis as most similar to interstitial macrophages (40). Unique to the IAV-exposed condition, we noted the presence of 2 populations we denoted as stressed transitional epithelial cells (STEs). These populations share a gene expression signature typical of previously published (41) Krt8High (also known as PATS [ref. 42], DATP [ref. 43], or ADI [ref. 44]) cell populations known to arise in diverse forms of lung epithelial cell injury. The presence of these cell states has been described within several days of injury in vivo, but they arise within hours following IAV infection in our AEO system. Furthermore, we detected a distal secretory-like population defined by joint expression of Sftpc and Scgb1a1, most prevalent at the 24-hour time point in unexposed AEOs (Figure 3, A and B). This population appears to arise with acquisition of Scgb1a1 expression in AT2 cells during the unexposed suspension, potentially as a response to suspension culture in the absence of other stressors (Figure 3, B and C). We note that there is likely a higher degree of heterogeneity of cell states present within both the epithelial and fibroblast populations, but the depth of multiome snRNA-seq was insufficient for confident definition of these more refined cell states.
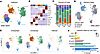 Figure 3
Single-nucleus analysis of flu infection in AEOs. (A) UMAP of cells from unexposed and flu-treated AEOs. (B) Cell state markers defining cell states shown in A. (C) Frequency of cell states observed in unexposed (“C”) and flu-treated (“F”) AEOs. (D–F) Infection states. (D) Overall UMAP. (E) Individual condition UMAPs showing unexposed AEOs, uninfected cells in flu-treated AEOs, and infected cells in flu-treated AEOs. (F) Overall rate of infection per cell type. AT1tr, AT1-like/transitional cells; STE, stressed transitional epithelial cell. Other abbreviations per main text.
Next, we identified the IAV infection state in cells. We generated an IAV expression score based on the number of IAV genes and expression levels to distinguish 3 classes of cells (see Methods): (a) “Unexposed” cells from IAV-naive AEO cultures, (b) “Infected” cells, which had high levels of flu-specific gene expression, and (c) “Uninfected” cells, which were exposed cells in IAV-treated cultures but did not meet the IAV gene expression thresholds for infection (Figure 3, D and E). Concordant with our AEO and in vivo IHC data, the majority of infected epithelium were AT2 cells with few infected AT1 cells. Surprisingly, we noted the presence of substantial populations of infected fibroblasts and myeloid cells (Figure 3E) with a highest enrichment at the 8-hour time point (Figure 3F). We suspect that these “off-target” infections are due to prolonged saturation with viral particles with no protective extracellular matrix. HA cleavage by epithelial cells may also improve viral availability for infection of mesenchymal lineages. Notably, both STE populations had a very low rate of flu infection.
Gene expression profiles of infected cells within AEOs. We next turned our attention to defining the pathways associated with infection state in AT2 cells. Within the “Infected” population, we defined cells as “Early” infection based on early gene signatures (expressing PB1 and PB2, PA, and PA-X, NP, NS1, and NEP) for genes involved in poly-A cap snatching, host machinery hijacking and disruption, and nuclear transport. We scored cells as “Late” infection due to expression of later-stage genes (M1 and M2, HA, NA, and PB-1-F2) involved in building the viral particle membrane and membrane proteins in addition to the “early” genes (Figure 4, A–C) (2). The resulting patterns of infection stage at each time point aligned with timelines previously reported in monolayer cell culture models (31). In AT2 cells, we detected “Early Infected” cells at each time point. We interpreted these results to indicate that cells experience ongoing infection while in suspension in IAV-containing media. We detected “Late Infected” cells by 8 hpi, less at 16 hpi, and then again increased at 24 hpi; these data suggest that our system allowed up to 2 full cycles of viral replication by 24 hpi (Figure 4, B and C).
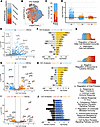 Figure 4
Trajectory of gene expression during IAV infection in AEOs. (A) Schematic color scheme of cell states in AEOs. Unexposed, gray; Uninfected, blue; Early IAV, orange; Late IAV, red. (B and C) UMAP (B) and frequency (C) showing infection states of AT2 cell subset of AEOs. (D) Strip plots showing number of differentially expressed genes (DEGs) and degree of enrichment across AT2 cell states. (E and F) Volcano plot of DEGs (E) and GO Biological Process enrichment (F) of genes in Unexposed (gray) versus Uninfected (blue) AT2 cells. (G and H) Volcano plot of DEGs (G) and GO Biological Process enrichment (H) of genes Uninfected (blue) versus Early Infected (orange) AT2 cells. (I–J) Volcano plot of DEGs (I) and GO Biological Process enrichment (J) of genes in Early Infected (orange) versus Late Infected (red) AT2 cells. Upregulated processes are shown in yellow, and downregulated processes in blue. (K) State dynamics of enrichment of GO terms from F, H, and J. Letter to left of process name matches letters to right of bars. Some terms are enriched at multiple time points. Diagrams in K show dynamics of change of associated terms (boxes) across cell states in AEOs.
To define the cell-state-specific effects of IAV infection on AT2 cells, we created pseudobulk profiles of cells scored as Unexposed, Uninfected, Early IAV, or Late IAV infection, ensuring even contribution of cells from each time point combined into the artificial replicates to prevent time point biases. We identified differentially expressed genes (DEGs) that we defined by an adjusted P value of less than 0.05 and a fold change (FC) of greater than 1.25 (Figure 4D) within these populations. Surprisingly, we noted the most DEGs comparing the Unexposed to Uninfected cells, with fewer changes between Uninfected to Early Infection, and few genes changed between Early and Late infection.
To evaluate major pathways associated with genes regulated across the course of AT2 infection, we performed Gene Ontology (GO) Biological Process (BP) term enrichment analysis (45, 46). Uninfected AT2 cells upregulated genes associated with pathways of AT2 stress response and immune signaling, including viral and interferon response (Figure 4, C and D). These terms were driven by leading-edge genes, including Krt8, Krt19, Cxcl10 (IP-10), and Ccl5 (RANTES) (Figure 4, E and F). Many of these genes and pathways were further upregulated in Early IAV cells compared with Uninfected AT2 (Figure 4, G and H), but then downregulated in Late IAV (Figure 4, I and J). The Late infection condition was instead defined by genes associated with pathways controlling protein folding, with higher expression of several heat shock protein genes and ER stress markers (Figure 4, I and K). Finally, we noted a substantial initial increase in intracellular markers of type 1 interferon response in AT2, including Irf5 and Isg15. Consistent with published results, this signature is then downregulated in late infection, which has been reported as a consequence of virus-mediated suppression (47). Taken together, these data unite several proposed mechanisms underlying influenza response in AT2 cells (47–50) (Figure 4K).
Cell epigenomic state changes in IAV infection. We next turned our attention to the epigenetic consequences of IAV infection by comparing Unexposed, Uninfected, and Infected AT2 cells in snATAC-seq data (Figure 5A). We identified differentially open regions of chromatin with a log2FC of greater than 0.25 and an FDR threshold of 0.05 within pseudobulk chromatin signatures from each of these cell states. Using an ArchR-like (49) approach to identify the top 25% most active (highly active) differentially regulated peaks (Figure 5B), we observed the largest difference in open chromatin between Uninfected versus Unexposed AT2 (Figure 5C). Taken with the snRNA-seq findings, these data implied that a majority of chromatin regulation was related to detection and early response to IAV in the system rather than direct infection in AT2 cells. We found marked changes in chromatin near MHC- and IRF-related genes in Uninfected cells. These genes are important for AT2 immune function and the associated RNAs were upregulated in Early Infected cells (Figure 4G and Figure 5C). GO terms associated with these differential peaks included terms associated with response to IL-1β, TNF-α, and suppression of viral genome replication. Chromatin in Uninfected AT2s was also more open near genes associated with keratinization, intermediate filament process, cellular response to inflammatory stimuli, and antigen presentation concordant with the observed changes in gene expression by snRNA-seq (Figure 4C and Figure 5D).
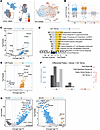 Figure 5
Dynamics of chromatin changes during IAV infection in AEOs. (A) Overall UMAP and AT2-only UMAP based on ATAC assay showing cell infection state. (B) Strip plot showing number and significance of differential peaks across AT2 cell states. (C and D) Volcano plot (C) and GO terms (D) showing nearest neighbor genes to differentially open chromatin enriched in Uninfected compared to Unexposed AT2 cells. (E) Volcano plot of nearest neighbor genes to differentially open chromatin in Early infected compared to Uninfected AT2 cells. (F) Bar chart showing the number of differentially open peaks, nearest neighbor genes, top 25% active (highly active) genes, and associated enriched GO terms. No enriched GO terms are associated with newly open chromatin in IAV-infected AT2 cells, and no differentially open chromatin regions passed thresholding for Early versus Late infection. (G) Motifs enriched in differentially open chromatin in Uninfected versus Unexposed (left) or Early infected versus Uninfected (right) AT2 cells.
We next turned our attention to chromatin changes induced by flu infection, comparing Uninfected and Early infected cells. We noted a large number of differentially accessible peaks in Early IAV (Figure 5E), but noted that these newly accessible peaks were not associated with enrichment of any specific GO BP terms (Figure 5F). We noted that while some chromatin regions were differentially accessible in Early IAV compared with Uninfected, none of these peaks passed our stringent thresholds for significance (Figure 5F). Recent reports have demonstrated that IAV inhibits transcriptional termination in cell lines, leading to widespread readthrough transcription and marked chromatin accessibility changes (17, 18). While we can not directly assess readthrough transcription in our snRNA-seq data, the randomly distributed chromatin changes present in IAV-infected cells likely represent the sequelae of readthrough transcription in infected AT2 cells.
Motif analysis of Unexposed compared to Uninfected AT2s predicted increased activity of transcription factor classes associated with cell shape change (Zeb1) (51) and MHC class II expression (Rfx3/7) (52), concordant with the anticipated need for injury response (Figure 5G). These data suggested that following viral detection in the milieu, AT2 cells are primed via inflammatory signaling to increase chromatin accessibility in key immune-activating factors that increase in transcription prior to and immediately following infection. Consistent with the transcriptome and peak accessibility data, motif analysis in Early IAV demonstrated very few enriched binding motifs within these differentially open regions (Figure 5G).
Stressed transitional cells arise from uninfected AT2 during response to IAV in AEOs. As noted above, we observed a large population of STEs exclusively in IAV-exposed AEOs. The STE state has been extensively described in recent pulmonary regeneration literature, where STEs have been shown to both participate in productive regeneration as well as accumulate in more chronic injury (41–44, 53–55). STEs arise within days in vivo, but were present by 8 hpi in AEOs, providing an opportunity to evaluate signatures and possible origins of STEs in IAV-infected AEOs.
Both STE populations were predicted by pseudotime analysis of snRNA-seq data to arise from the AT2 population (Figure 6A). Although our system does not include a lineage tracing marker to validate this predicted relationship, uninfected AT2s showed enrichment at the ATAC level for gene programs associated with the transition to the STE state, including keratinization and intermediate filament–associated gene categories relative to unexposed AT2s (Figure 5, C and D). STE populations in AEOs were defined by RNA expression of cytokeratins 5, 8, and 19 among other established epithelial stress markers (Figure 6B). Both populations expressed components of the “typical” DATP/PATS/ADI/ABI cell (41–44, 53–55) profile described in the literature; however, the STE2 population was particularly Krt8hi and marked by expression of Cdkn1a, Cdkn2a, and Sfn, markers that have been reported in more pathogenic STEs. Both STE populations expressed low levels of the recovery markers Isg15 and Oas1a (Figure 6B), similar to uninfected AT2 cells, suggesting STEs do not arise from AT2 cells recovered from IAV infection.
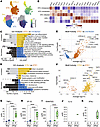 Figure 6
STEs arise from uninfected AT2 cells driven by inflammatory signaling. (A) Epithelial-only UMAP (left) and pseudotime trajectory (right) suggesting that STEs arise from AT2 cells in IAV-treated AEOs. (B) Marker gene expression of a series of AT2 and STE markers defining cell state in AEOs. (C and D) GO Biological Process terms based on DEGs for (C) Uninfected AT2 cells versus STE1s and (D) STE1s versus STE2s. (E and F) Motif activity enrichment based on differentially open chromatin (E) in Uninfected AT2s versus STE1s and (F) and motif activity enrichment based on differentially open chromatin (F) in STE2s versus STE1s. Major reported regulators of STE transition, including reduction in NKX2-1 activity, IL-1β signaling driving FOS/JUN signaling, and TGF-β signaling are identified in STE1s versus AT2 cells. (G–K) Cytokine ELISAs demonstrating enrichment of multiple IAV-associated cytokines in the media of IAV-infected AEOs. Compare to Supplemental Figure 5. ****P < 0.0001 by 2-way ANOVA with prespecified multiple comparisons.
When we compared DEGs in STEs compared to uninfected AT2 cells (Figure 6C), we noted enrichment of genes associated with ER stress response pathways, inflammatory signaling, pathways associated with organization of keratins, and p53 signaling. All of these signaling pathways have been associated with STE acquisition in previous literature, supporting the model that STEs arise from uninfected AT2s. We noted downregulation of AT2-associated pathways, including lipid metabolism, secretory regulation, and ion transport as well as terms associated with key aspects of ARDS pathogenesis, including local surfactant deficiency and alveolar edema. The shift to STE2 from STE1 was primarily characterized by cytoskeletal, microtubule, and ciliary terms, and a reduction in niche signaling response in the TNF and JAK/STAT pathways (Figure 6D).
An inflammatory signaling milieu drives STE acquisition in IAV-infected AEO. We next assessed differential motifs found in chromatin open in STE1 relative to uninfected AT2 cells to predict transcription factor activity (Figure 6E). Motif analysis demonstrated a reduction in predicted NKX2-1 activity and increases in predicted regulation by FOS:JUN and SMAD2:SMAD3 motifs in STE1. STE acquisition has been reported following TGF-β signaling upstream of SMAD2/3 (41), and after loss of function of NKX2-1 (24), suggesting similarities in the gene programs driving STE acquisition following IAV infection in AEOs and in other injury models. Interestingly, STE2-enriched motifs included high predicted activity for TGF-β target genes and feedback inhibitors TGIF1 and TGIF2 (Figure 6F), suggesting modulation of TGF-β signaling may underlie some differences separating the STE1 versus STE2 states. RNA expression of Tgfb1 was not changed in snRNA-seq data and activated TGF-β ligand was not changed in stroma exposed to IAV based on ELISA (Supplemental Figure 4), suggesting that changes in TGF-β processing or response might be responsible for these changes.
Although the specific trigger for STE acquisition in lung injury is unknown, multiple studies have suggested an inflammation-driven process. Previous literature has directly demonstrated a role for IL-1β (43) signaling in STE transition. FOS/JUN activation is a hallmark of cellular response to IL-1β and other proinflammatory cytokines, leading to the hypothesis that inflammatory cytokines induced by influenza may participate in AT2 to STE transitions. To determine which proinflammatory factors are present in the milieu of infected AEOs, we compared RNA expression (Supplemental Figure 5) to protein abundance by ELISA (Figure 6, G–K, and Supplemental Figure 5) for a panel of inflammatory cytokines in IAV-treated or untreated cultures. Protein expression of IFN-α and IL-1β was only detectable in IAV-treated cultures at 24 hpi, and RANTES, TNF-α, and IP-10 were detectable at multiple time points but significantly upregulated only at 24 hpi (Figure 6, G–K). We observed upregulation of RNA for multiple proinflammatory cytokines in fibroblasts in IAV-infected cultures, including the Type 1 interferons IFN-α and IFN-β, IL-6, IP-10/CXCL10, and RANTES/CCL5. We also noted increased RNA expression for several overlapping and additional cytokines from myeloid cells in AEOs, including IL-1β, TNF-α, RANTES, and MIP1α and MIP1β. These data support the conclusion that the AT2-STE transition in IAV-exposed AEOs was likely driven by an inflammatory signaling milieu.
Generation and characterization of IAV infection in primary human AEOs. Next, we used published methods (15, 56, 57) to generate primary AEOs from a single healthy 4-year-old human lung that was not utilized for clinical transplantation. We isolated human AT2 cells via FACS (EpCAM+, LysoTracker+, Live cells) from otherwise healthy lung (Figure 7A, see Methods for donor details). Isolated AT2 cells were cultured in similar conditions to murine cells and using MRC5 cells as mesenchymal feeder cells. These human cultures grew faster than the murine-derived AEOs and generated organoids comprised of numerous AT2 cells (Figure 7B) without the AT1 differentiation or internal complexity or cavitation observed in mouse AEO cultures. We then proceeded to IAV infection in these human AEOs.
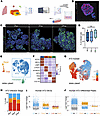 Figure 7
Single-nucleus analysis of flu infection in human AEOs. (A) Schematic describing the coculture of freshly sorted human epithelial cells with MRC5 fibroblasts from a single 4-year-old donor for creation of hundreds of human AEOs. (B) IHC demonstrating clear punctate SPC expression in human AEOs; we noted relatively low-level HT2-280 expression in established AEO culture. (C and D) Dynamics of PR8 IAV infection in AEOs, showing high levels of nuclear NP expression (C), which is quantified in D. (E and F) UMAP projection (E) and cell marker gene expression (F) of cell states found in human AEOs. (G and H) UMAP of AT2 cell subset (G) and quantification (H) showing imputed flu infection state as was done for murine organoids. (I and J) Strip plots showing differentially expressed genes (I) or differentially accessible chromatin regions (J) in Uninfected versus Unexposed, Early Infected versus Uninfected, and Late Infected versus Early Infected human AT2 cells. Scale bars: 50 μm. Statistics in D via 1-way ANOVA with prespecified multiple comparisons.
To control for virus-specific factors, we used the same PR8 influenza used for murine AEO infection. PR8 is adapted from human pandemic H1N1 but is a mouse attenuated virus and our human AEOs achieved more than double our murine average colony-forming efficiency, creating dense cultures. We therefore doubled the viral load to 2.05 × 10⁶ PFU/well to ensure a similar MOI in human AEOs to that in murine AEOs. Human AEOs underwent efficient infection, with more infected AT2 cells present at 8 hpi and 16 hpi compared with mouse AEOs, but a peak at 24 hpi similar to mouse (Figure 7, C and D). We then proceeded to sequencing via multiome paired snRNA-seq and snATAC-seq from pools of over 300 individual AEOs per condition.
Following nuclei isolation using the same protocol as for mouse AEOs, our snRNA-seq data contained 38,610 single-cell transcriptomes with a range of 5,793 to 7,478 cells per time point and condition, with a median of 3,527 UMIs (interquartile range 1,749–4,795) per cell, and a median of 1,927 genes (interquartile range 1,134–2,374) per cell. Over 75% of cells collected were identified as AT2s with the expected fibroblast presence from the MRC5 coculture (Figure 7, E and F). We observed some airway cell contamination of basal and secretory cells, which were morphologically apparent in human AEO wells and present in both control and IAV-treated cultures, suggesting they originated in the culture prior to the onset of IAV infection. Notably, we did not observe the development of an STE population in the human AEO culture. We hypothesized that the human AEO milieu was less proinflammatory than the murine AEO cultures; this interpretation was supported by snRNA-seq data showing only low level upregulation of RNA for key inflammatory cytokines, including TNF-α, IL-1β, IL-6, IP-10/CXCL10, and RANTES/CCL5 in human AEOs (Supplemental Figure 5). MRC5-derived feeder cells and the absence of an immune population resulted in expression of a smaller number of these proinflammatory cytokines, and at a lower level, than the murine primary feeder cells, suggesting that the absence of STEs in human AEOs may relate to an overall decrease in inflammatory signaling in non-epithelial cells following IAV infection. We can not, however, exclude the possibility that donor- or species-specific mechanisms could also be contributing to these differences in epithelial cell state given the high variance in human organoid cultures and fibroblast effects in published studies.
Human AEOs contained a large population of AT2 cells within each of the infection classes defined previously, so we used similar methods to classify Unexposed, Uninfected, Early, and Late Infected human AT2 cells (Figure 7, G and H). Consistent with IHC data, we noted more cells classified as Late Infected even at 8 hpi, with similar distribution at 16 hpi and a notable decrease in both infected Late Infected populations at 24 hpi, potentially suggesting a more rapid saturation of infection in human AEOs. We then performed DEG (Figure 7I) and differential chromatin accessibility analyses (Figure 7J) using the same analytical pipelines as used for the murine data. We noted similar dynamics of gene expression (Supplemental Figure 6) and chromatin accessibility in humans as in mice, with the largest changes notable comparing Unexposed to Uninfected AT2 driven by viral and immune response pathways. IAV infection led to a burst of translation-related pathways, consistent with viral replication driven by infection. This was followed by a substantial decrease in inflammatory pathways during Late infection, consistent with virus-mediated suppression as infection progresses (Supplemental Figure 4). These similar patterns implied a core conserved response to IAV across mammalian AT2 cells.
Defining a core, evolutionarily conserved viral response in IAV-infected AT2 cells. To identify this core antiviral response in AT2 cells after IAV infection, we developed a 2-step cross-comparison of the snRNA-seq results from the mouse and human AEOs to identify strongly conserved genes and pathways (Figure 8A). Using DEG signatures derived from pseudobulk expression profiles for each cell state (Unexposed, Uninfected, Early IAV, Late IAV) in both human and mouse, we performed pathway analysis and gene set enrichment analysis (GSEA) to identify conserved orthologs in the gene expression data (see Methods), and displayed GO pathway enrichment (Figure 8A and Supplemental Figure 7) that defined the AT2 response to IAV. We used stringent thresholds to avoid overinterpretation of sparse data and define a relatively small core conserved gene list for each stage of infection.
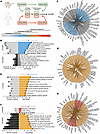 Figure 8
A conserved signature of IAV infection in AEOs. (A) Schematic depicting data analysis pipeline (see Results and Methods) used to identify core conserved regulated pathways and gene sets in IAV-infected AEOs comparing murine and human organoids from a 4-year-old donor. (B and C) Enriched and downregulated GO terms (B) in Unexposed versus Uninfected AT2, with leading-edge genes per GO terms in C. (D and E) Enriched GO terms (D) in Uninfected versus Early IAV AT2, with leading-edge genes per GO term in E. (F and G) Enriched and downregulated GO terms (F) in Early versus Late IAV infection in AT2, with leading-edge genes per GO term in G.
As expected, we found an early upregulation of genes associated with antiviral and proinflammatory signaling in Uninfected AT2, corresponding to the primed chromatin accessibility seen in this state in both species. GO BP output defined key pathways in viral response and immune activation (Figure 8B), with leading-edge genes that defined these signatures, including NFKB, TLR3, MYD88, STAT1, and ISG15 (Figure 8C and Supplemental File 1). Uninfected AT2 cells downregulated metabolic pathways necessary for surfactant metabolism, including fatty acid β-oxidation and lipid catabolic processes (Figure 8B), with these signatures defined by a decrease in critical metabolic enzymes, including ACACB and PCCA. Immunofluorescent staining of murine AEOs confirms loss of SPC staining in NP+ infected cells early, with increasing NP– AT2 SPC loss later (Supplemental Figure 8A).
Comparing Early infection to Uninfected AT2, we noted no downregulated pathways and found that 87% of pathways enriched in Early infection were present in the Uninfected signature but further upregulated following infection initiation (Figure 8, D and E). The remaining 13% of pathways and leading-edge genes included those associated with viral infection, with an increase in vesicle trafficking, viral assembly, and budding, as well as regulation of cell death. At the Late IAV stage, we noted upregulation of ER stress and protein folding response pathways, with leading-edge genes including chaperones HSPA5 and HSP90B1 and the critical ER regulator CANX. Antiviral pathways were broadly downregulated, suggesting conservation of virus-mediated immune suppression in late infection across both murine and human AT2 cells. These trends are defined by decreased expression of previously upregulated factors from the primed state, including NF-κB, MAPK, IFN, apoptotic signaling, and other immune cell mediators (Figure 8, F and G).


