
Research ArticleMetabolismMuscle biology
Open Access |  10.1172/jci.insight.201810
Semaglutide-induced loss of skeletal muscle mass is blunted by co-administration of ketone esters
Yasser Abuetabh,1,2,3,4 Mya A. Schmidt,1,2,3,4 Masaaki Naganuma,1,2,3,4 Ramana Vaka,1,2,3,4 Mahmoud A. El-Ghiaty,1,2,3,4 Shelly Braun,5 Ethan A. Kwan,1,2,3,4 Matthieu C.P. Zolondek,1,2,3,4 Darius Sahid,1,2,3,4 Laibah Khan,1,2,3,4 Rajat K. Shandal,1,2,3,4 Ashley L. Trudeau,1,2,3,4 Yaning Li,1,2,3,4 Sufyan O. Malik,1,2,3,4 Qiuyu Sun,1,2,3,4 Danica K. Roth,1,2,3,4 Daniela Y. Morales-Llamas,1,2,3,4 Jody L. Levasseur,1,2,3,4 Mourad Ferdaoussi,2,6 Richard P. Fahlman,5 and Jason R.B. Dyck1,2,3,4
1Cardiovascular Research Centre,
2Alberta Diabetes Institute,
3Women and Children’s Health Research Institute,
4Department of Pediatrics,
5Department of Biochemistry, Faculty of Medicine & Dentistry, and
6Faculty Saint-Jean, University of Alberta, Edmonton, Alberta, Canada.
Address correspondence to: Jason R.B. Dyck, 458 Heritage Medical Research Centre, University of Alberta, Edmonton, Alberta T6G 2S2, Canada. Phone: 780.492.0314; Email: jason.dyck@ualberta.ca.
Authorship note: YA, MAS, and MN are co–first authors.
Find articles by Abuetabh, Y. in: PubMed | Google Scholar
1Cardiovascular Research Centre,
2Alberta Diabetes Institute,
3Women and Children’s Health Research Institute,
4Department of Pediatrics,
5Department of Biochemistry, Faculty of Medicine & Dentistry, and
6Faculty Saint-Jean, University of Alberta, Edmonton, Alberta, Canada.
Address correspondence to: Jason R.B. Dyck, 458 Heritage Medical Research Centre, University of Alberta, Edmonton, Alberta T6G 2S2, Canada. Phone: 780.492.0314; Email: jason.dyck@ualberta.ca.
Authorship note: YA, MAS, and MN are co–first authors.
Find articles by Schmidt, M. in: PubMed | Google Scholar
1Cardiovascular Research Centre,
2Alberta Diabetes Institute,
3Women and Children’s Health Research Institute,
4Department of Pediatrics,
5Department of Biochemistry, Faculty of Medicine & Dentistry, and
6Faculty Saint-Jean, University of Alberta, Edmonton, Alberta, Canada.
Address correspondence to: Jason R.B. Dyck, 458 Heritage Medical Research Centre, University of Alberta, Edmonton, Alberta T6G 2S2, Canada. Phone: 780.492.0314; Email: jason.dyck@ualberta.ca.
Authorship note: YA, MAS, and MN are co–first authors.
Find articles by Naganuma, M. in: PubMed | Google Scholar
1Cardiovascular Research Centre,
2Alberta Diabetes Institute,
3Women and Children’s Health Research Institute,
4Department of Pediatrics,
5Department of Biochemistry, Faculty of Medicine & Dentistry, and
6Faculty Saint-Jean, University of Alberta, Edmonton, Alberta, Canada.
Address correspondence to: Jason R.B. Dyck, 458 Heritage Medical Research Centre, University of Alberta, Edmonton, Alberta T6G 2S2, Canada. Phone: 780.492.0314; Email: jason.dyck@ualberta.ca.
Authorship note: YA, MAS, and MN are co–first authors.
Find articles by Vaka, R. in: PubMed | Google Scholar
1Cardiovascular Research Centre,
2Alberta Diabetes Institute,
3Women and Children’s Health Research Institute,
4Department of Pediatrics,
5Department of Biochemistry, Faculty of Medicine & Dentistry, and
6Faculty Saint-Jean, University of Alberta, Edmonton, Alberta, Canada.
Address correspondence to: Jason R.B. Dyck, 458 Heritage Medical Research Centre, University of Alberta, Edmonton, Alberta T6G 2S2, Canada. Phone: 780.492.0314; Email: jason.dyck@ualberta.ca.
Authorship note: YA, MAS, and MN are co–first authors.
Find articles by El-Ghiaty, M. in: PubMed | Google Scholar
1Cardiovascular Research Centre,
2Alberta Diabetes Institute,
3Women and Children’s Health Research Institute,
4Department of Pediatrics,
5Department of Biochemistry, Faculty of Medicine & Dentistry, and
6Faculty Saint-Jean, University of Alberta, Edmonton, Alberta, Canada.
Address correspondence to: Jason R.B. Dyck, 458 Heritage Medical Research Centre, University of Alberta, Edmonton, Alberta T6G 2S2, Canada. Phone: 780.492.0314; Email: jason.dyck@ualberta.ca.
Authorship note: YA, MAS, and MN are co–first authors.
Find articles by Braun, S. in: PubMed | Google Scholar
1Cardiovascular Research Centre,
2Alberta Diabetes Institute,
3Women and Children’s Health Research Institute,
4Department of Pediatrics,
5Department of Biochemistry, Faculty of Medicine & Dentistry, and
6Faculty Saint-Jean, University of Alberta, Edmonton, Alberta, Canada.
Address correspondence to: Jason R.B. Dyck, 458 Heritage Medical Research Centre, University of Alberta, Edmonton, Alberta T6G 2S2, Canada. Phone: 780.492.0314; Email: jason.dyck@ualberta.ca.
Authorship note: YA, MAS, and MN are co–first authors.
Find articles by Kwan, E. in: PubMed | Google Scholar
1Cardiovascular Research Centre,
2Alberta Diabetes Institute,
3Women and Children’s Health Research Institute,
4Department of Pediatrics,
5Department of Biochemistry, Faculty of Medicine & Dentistry, and
6Faculty Saint-Jean, University of Alberta, Edmonton, Alberta, Canada.
Address correspondence to: Jason R.B. Dyck, 458 Heritage Medical Research Centre, University of Alberta, Edmonton, Alberta T6G 2S2, Canada. Phone: 780.492.0314; Email: jason.dyck@ualberta.ca.
Authorship note: YA, MAS, and MN are co–first authors.
Find articles by Zolondek, M. in: PubMed | Google Scholar
1Cardiovascular Research Centre,
2Alberta Diabetes Institute,
3Women and Children’s Health Research Institute,
4Department of Pediatrics,
5Department of Biochemistry, Faculty of Medicine & Dentistry, and
6Faculty Saint-Jean, University of Alberta, Edmonton, Alberta, Canada.
Address correspondence to: Jason R.B. Dyck, 458 Heritage Medical Research Centre, University of Alberta, Edmonton, Alberta T6G 2S2, Canada. Phone: 780.492.0314; Email: jason.dyck@ualberta.ca.
Authorship note: YA, MAS, and MN are co–first authors.
Find articles by Sahid, D. in: PubMed | Google Scholar
1Cardiovascular Research Centre,
2Alberta Diabetes Institute,
3Women and Children’s Health Research Institute,
4Department of Pediatrics,
5Department of Biochemistry, Faculty of Medicine & Dentistry, and
6Faculty Saint-Jean, University of Alberta, Edmonton, Alberta, Canada.
Address correspondence to: Jason R.B. Dyck, 458 Heritage Medical Research Centre, University of Alberta, Edmonton, Alberta T6G 2S2, Canada. Phone: 780.492.0314; Email: jason.dyck@ualberta.ca.
Authorship note: YA, MAS, and MN are co–first authors.
Find articles by Khan, L. in: PubMed | Google Scholar
1Cardiovascular Research Centre,
2Alberta Diabetes Institute,
3Women and Children’s Health Research Institute,
4Department of Pediatrics,
5Department of Biochemistry, Faculty of Medicine & Dentistry, and
6Faculty Saint-Jean, University of Alberta, Edmonton, Alberta, Canada.
Address correspondence to: Jason R.B. Dyck, 458 Heritage Medical Research Centre, University of Alberta, Edmonton, Alberta T6G 2S2, Canada. Phone: 780.492.0314; Email: jason.dyck@ualberta.ca.
Authorship note: YA, MAS, and MN are co–first authors.
Find articles by Shandal, R. in: PubMed | Google Scholar
1Cardiovascular Research Centre,
2Alberta Diabetes Institute,
3Women and Children’s Health Research Institute,
4Department of Pediatrics,
5Department of Biochemistry, Faculty of Medicine & Dentistry, and
6Faculty Saint-Jean, University of Alberta, Edmonton, Alberta, Canada.
Address correspondence to: Jason R.B. Dyck, 458 Heritage Medical Research Centre, University of Alberta, Edmonton, Alberta T6G 2S2, Canada. Phone: 780.492.0314; Email: jason.dyck@ualberta.ca.
Authorship note: YA, MAS, and MN are co–first authors.
Find articles by Trudeau, A. in: PubMed | Google Scholar
1Cardiovascular Research Centre,
2Alberta Diabetes Institute,
3Women and Children’s Health Research Institute,
4Department of Pediatrics,
5Department of Biochemistry, Faculty of Medicine & Dentistry, and
6Faculty Saint-Jean, University of Alberta, Edmonton, Alberta, Canada.
Address correspondence to: Jason R.B. Dyck, 458 Heritage Medical Research Centre, University of Alberta, Edmonton, Alberta T6G 2S2, Canada. Phone: 780.492.0314; Email: jason.dyck@ualberta.ca.
Authorship note: YA, MAS, and MN are co–first authors.
Find articles by Li, Y. in: PubMed | Google Scholar
1Cardiovascular Research Centre,
2Alberta Diabetes Institute,
3Women and Children’s Health Research Institute,
4Department of Pediatrics,
5Department of Biochemistry, Faculty of Medicine & Dentistry, and
6Faculty Saint-Jean, University of Alberta, Edmonton, Alberta, Canada.
Address correspondence to: Jason R.B. Dyck, 458 Heritage Medical Research Centre, University of Alberta, Edmonton, Alberta T6G 2S2, Canada. Phone: 780.492.0314; Email: jason.dyck@ualberta.ca.
Authorship note: YA, MAS, and MN are co–first authors.
Find articles by Malik, S. in: PubMed | Google Scholar
1Cardiovascular Research Centre,
2Alberta Diabetes Institute,
3Women and Children’s Health Research Institute,
4Department of Pediatrics,
5Department of Biochemistry, Faculty of Medicine & Dentistry, and
6Faculty Saint-Jean, University of Alberta, Edmonton, Alberta, Canada.
Address correspondence to: Jason R.B. Dyck, 458 Heritage Medical Research Centre, University of Alberta, Edmonton, Alberta T6G 2S2, Canada. Phone: 780.492.0314; Email: jason.dyck@ualberta.ca.
Authorship note: YA, MAS, and MN are co–first authors.
Find articles by Sun, Q. in: PubMed | Google Scholar
1Cardiovascular Research Centre,
2Alberta Diabetes Institute,
3Women and Children’s Health Research Institute,
4Department of Pediatrics,
5Department of Biochemistry, Faculty of Medicine & Dentistry, and
6Faculty Saint-Jean, University of Alberta, Edmonton, Alberta, Canada.
Address correspondence to: Jason R.B. Dyck, 458 Heritage Medical Research Centre, University of Alberta, Edmonton, Alberta T6G 2S2, Canada. Phone: 780.492.0314; Email: jason.dyck@ualberta.ca.
Authorship note: YA, MAS, and MN are co–first authors.
Find articles by Roth, D. in: PubMed | Google Scholar
1Cardiovascular Research Centre,
2Alberta Diabetes Institute,
3Women and Children’s Health Research Institute,
4Department of Pediatrics,
5Department of Biochemistry, Faculty of Medicine & Dentistry, and
6Faculty Saint-Jean, University of Alberta, Edmonton, Alberta, Canada.
Address correspondence to: Jason R.B. Dyck, 458 Heritage Medical Research Centre, University of Alberta, Edmonton, Alberta T6G 2S2, Canada. Phone: 780.492.0314; Email: jason.dyck@ualberta.ca.
Authorship note: YA, MAS, and MN are co–first authors.
Find articles by Morales-Llamas, D. in: PubMed | Google Scholar
1Cardiovascular Research Centre,
2Alberta Diabetes Institute,
3Women and Children’s Health Research Institute,
4Department of Pediatrics,
5Department of Biochemistry, Faculty of Medicine & Dentistry, and
6Faculty Saint-Jean, University of Alberta, Edmonton, Alberta, Canada.
Address correspondence to: Jason R.B. Dyck, 458 Heritage Medical Research Centre, University of Alberta, Edmonton, Alberta T6G 2S2, Canada. Phone: 780.492.0314; Email: jason.dyck@ualberta.ca.
Authorship note: YA, MAS, and MN are co–first authors.
Find articles by Levasseur, J. in: PubMed | Google Scholar
1Cardiovascular Research Centre,
2Alberta Diabetes Institute,
3Women and Children’s Health Research Institute,
4Department of Pediatrics,
5Department of Biochemistry, Faculty of Medicine & Dentistry, and
6Faculty Saint-Jean, University of Alberta, Edmonton, Alberta, Canada.
Address correspondence to: Jason R.B. Dyck, 458 Heritage Medical Research Centre, University of Alberta, Edmonton, Alberta T6G 2S2, Canada. Phone: 780.492.0314; Email: jason.dyck@ualberta.ca.
Authorship note: YA, MAS, and MN are co–first authors.
Find articles by
Ferdaoussi, M.
in:
PubMed
|
Google Scholar
|

1Cardiovascular Research Centre,
2Alberta Diabetes Institute,
3Women and Children’s Health Research Institute,
4Department of Pediatrics,
5Department of Biochemistry, Faculty of Medicine & Dentistry, and
6Faculty Saint-Jean, University of Alberta, Edmonton, Alberta, Canada.
Address correspondence to: Jason R.B. Dyck, 458 Heritage Medical Research Centre, University of Alberta, Edmonton, Alberta T6G 2S2, Canada. Phone: 780.492.0314; Email: jason.dyck@ualberta.ca.
Authorship note: YA, MAS, and MN are co–first authors.
Find articles by Fahlman, R. in: PubMed | Google Scholar
1Cardiovascular Research Centre,
2Alberta Diabetes Institute,
3Women and Children’s Health Research Institute,
4Department of Pediatrics,
5Department of Biochemistry, Faculty of Medicine & Dentistry, and
6Faculty Saint-Jean, University of Alberta, Edmonton, Alberta, Canada.
Address correspondence to: Jason R.B. Dyck, 458 Heritage Medical Research Centre, University of Alberta, Edmonton, Alberta T6G 2S2, Canada. Phone: 780.492.0314; Email: jason.dyck@ualberta.ca.
Authorship note: YA, MAS, and MN are co–first authors.
Find articles by Dyck, J. in: PubMed | Google Scholar
Published June 9, 2026 - More info
JCI Insight. 2026;11(15):e201810. https://doi.org/10.1172/jci.insight.201810.
© 2026 Abuetabh et al. This work is licensed under the Creative Commons Attribution 4.0 International License. To view a copy of this license, visit http://creativecommons.org/licenses/by/4.0/.
Received: November 10, 2025; Accepted: May 29, 2026

-
Results
In vivo assessment of ketone ester treatment in combination with semaglutide treatment of obese mice demonstrates prevention of semaglutide-induced loss of skeletal muscle mass. Our previous work showing that lean mass is reduced by semaglutide treatment in obese mice was performed on obese mice fed a high-fat, high-sucrose diet consisting of 45% fat with no signs of glucose intolerance (22). Therefore, to investigate whether the same effects were observed in obese mice that were glucose intolerant, we fed 8-week-old male mice either a chow diet (control) or a diet consisting of 60% high fat for 15–17 weeks. To characterize the effects of this diet-induced obesity model, we show that over the 15–17 weeks of a high-fat diet, mice became obese (with an average body weight of 48.3 ± 0.6 g) and displayed significant glucose intolerance as assessed by an intraperitoneal glucose tolerance test (IPGTT; Figure 1, A and B). After confirmation of this model, our goal was to treat mice with semaglutide in the presence and absence of a ketone ester to determine whether ketone supplementation could prevent loss of skeletal muscle mass. Before treating the experimental cohort of mice, we first confirmed that the amount of ketone ester provided in the drinking water was sufficient to elevate β-hydroxybutyrate levels in the blood of obese mice to within physiologically normal levels (Figure 1C).
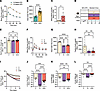 Figure 1
Ketone ester co-administration prevents semaglutide-induced lean mass loss without impacting fat loss. (A) Intraperitoneal glucose tolerance testing (IPGTT) was performed on male C57BL/6N and C57BL/6J mice after 15 weeks of high-fat diet (HFD) or standard chow (STD) (n = 10–30). (B) Glucose clearance represented by the area under the curve (AUC) of the IPGTT of A. (C) Blood β-hydroxybutyrate (ketone) concentrations were measured in obese mice following either vehicle administration (V) or twice-daily administration of 0.114 g/mL ketone ester in drinking water (V+K). (D) Schematic of the treatment timeline and group allocations. Created with BioRender.com. (E) The starting body weights of the studied groups, vehicle (V), semaglutide (S), and semaglutide combined with ketone ester (S+K). (F) IPGTT was repeated after 3 weeks of treatment with vehicle (V), semaglutide (S), or semaglutide combined with ketone ester (S+K) (n = 7–10). (G) Glucose clearance represented by the AUC of the IPGTT of F. (H) Fasting insulin levels. (I) Daily body weight measurements throughout the duration of the study. (J–L) Changes in body weight, fat mass, and lean mass were assessed following the 3-week intervention period using EchoMRI (n = 6–13). For comparisons among 3 groups, 1-way ANOVA was performed followed by Tukey’s multiple-comparison test (*P < 0.05; **P < 0.01; ***P < 0.001; ****P < 0.0001). All data are expressed as mean ± SEM. Data presented in this figure were obtained from experiments performed on male C57BL/6N and C57BL/6J mice.
For the experimental cohort, after 15–17 weeks of a high-fat diet, the obese mice were switched to a regular chow diet to represent the 500-kcal-deficit-per-day changes of participants in the STEP1 trial (1) and randomly allocated to receive daily injections of either phosphate-buffered saline (PBS), semaglutide, or semaglutide plus ketone ester in their drinking water for 3 weeks (Figure 1D). Using this protocol, similarly obese mice from all 3 groups (Figure 1E) that were treated with semaglutide alone or in combination with the ketone ester displayed an expected improvement in IPGTT (Figure 1, F and G). Given that increased ketone levels in the blood are associated with progressive insulin resistance in humans (23) and that ketosis can initially increase insulin secretion that can lead to β cell exhaustion and hyperglycemia (24), we also confirmed that there were no differences in insulin concentrations in the semaglutide-treated versus the semaglutide + ketone ester–treated mice (Figure 1H). Additionally, mice were weighed daily, and we show that while vehicle-treated mice lost a small amount of body weight (BW), likely as a result of being switched to a regular chow diet, semaglutide-treated mice lost significantly more BW (Figure 1I). Interestingly, semaglutide + ketone ester–treated mice lost an amount of BW equivalent to the amount lost by the semaglutide-treated mice until day 12, at which point they lost no more BW for the remainder of the 21-day injection period. To investigate what contributed to this relative preservation of BW in semaglutide + ketone ester–treated mice at 21 days, we subjected mice to body composition analysis using EchoMRI to assess changes in lean and fat mass. Although semaglutide + ketone ester–treated mice lost less overall BW compared with those receiving semaglutide alone (Figure 1J), this difference was not attributable to alterations in fat mass reduction between treatment groups (Figure 1K), but rather to a marked preservation of lean mass in the semaglutide + ketone ester–treated group (Figure 1L). Together, these data show that the greater absolute BW loss in semaglutide- versus semaglutide + ketone ester–treated mice was driven by greater loss of lean mass, and that ketone administration effectively prevents semaglutide-induced lean mass loss.
Ketone esters in combination with semaglutide treatment of obese mice result in improved skeletal muscle function. In order to assess whether the preservation of lean mass resulting from ketone ester cotreatment with semaglutide results in improved skeletal muscle function in mice, we performed indirect skeletal muscle functional assays, including rearing activity, an all-limb grip strength test using a force gauge, and a running exercise performance test using a motorized treadmill (Figure 2A) as previously described (25). Firstly, our data demonstrate that mice treated with semaglutide had significantly reduced rearing activity compared with PBS-treated mice, and that this reduction showed a trend toward improvement in semaglutide-treated mice receiving ketone esters (Figure 2B). Additionally, combined forelimb and hind-limb grip strength tests revealed that grip strength was significantly reduced in semaglutide-treated mice compared with PBS control mice (Figure 2C) but that this reduction was prevented by co-administration of ketone esters (Figure 2C). Furthermore, time to exhaustion on the motorized treadmill did not differ between vehicle- and semaglutide-treated mice, likely because vehicle-treated mice remained obese while semaglutide-treated mice had reduced skeletal muscle mass (Figure 2D). Nevertheless, co-administration of semaglutide with ketone esters led to a significant improvement in the time to exhaustion in comparison with the other 2 groups (Figure 2D). Together, these data suggest that the preservation of skeletal muscle mass translates to improved muscle performance in semaglutide-treated mice that also received ketone ester supplementation.
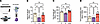 Figure 2
Ketone ester co-administration with semaglutide treatment prevents functional muscular decline and enhances physical performance. (A) Schematic depicting assessments of spontaneous rearing activity, grip strength, and treadmill endurance. Created with BioRender.com. (B) Rearing activity (n = 6–12). (C) Combined forelimb and hind-limb grip strength (n = 6–13). (D) Treadmill endurance (n = 6–12). Groups of mice are represented as vehicle (V), semaglutide (S), and semaglutide combined with ketone ester (S+K). Data presented in B–D were obtained from experiments performed on male C57BL/6N and C57BL/6J mice. For comparisons among 3 groups, 1-way ANOVA was performed followed by Tukey’s multiple-comparison test (**P < 0.01; ****P < 0.0001). All data are expressed as mean ± SEM.
Direct assessment of skeletal muscle mass in semaglutide-treated obese mice in the absence and presence of ketone esters. To confirm that our in vivo assessment of lean mass was indeed reflective of the loss of skeletal muscle mass in our semaglutide-treated mice, we euthanized the mice and directly assessed the weight of individual skeletal muscle groups. Skeletal muscle from each mouse was isolated, and quadriceps, gastrocnemius, soleus, and tibialis anterior muscles were dissected and weighed. Given that tibia lengths were not different between groups (vehicle, 20.20 ± 0.21 mm; semaglutide, 19.97 ± 0.02 mm; semaglutide + ketone ester, 19.87 ± 0.03 mm), and thus there were no apparent effects on body length or structural proportions, muscle mass was reported in absolute values. As expected from a previous study (12), each of the 4 skeletal muscle groups in the semaglutide-treated mice demonstrated a significant reduction in mass in comparison with vehicle-treated mice. Strikingly, ketone ester cotreatment with semaglutide significantly preserved the mass of these muscles (Figure 3, A–D), with more dramatic effects observed in quadriceps and soleus muscles and less pronounced effects observed in the gastrocnemius and tibialis anterior muscles. Since there do not appear to be any specific commonalities between the 2 distinct pairs of muscle groups that have differential responses to ketone ester cotreatment, further studies are required to fully understand these differences. Nevertheless, these results parallel the preservation of lean mass and skeletal muscle function observed in our prior experiments (Figure 1L and Figure 2, B–D). In addition, histological analysis of the gastrocnemius muscle showed that semaglutide decreased myocyte surface area, while ketone ester cotreatment with semaglutide prevented these decreases even in the least responsive muscles (Figure 3, E and F). These data demonstrate that the reduced muscle mass in semaglutide-treated mice reflects smaller myocytes rather than decreases in intrafibrillar or intermuscular fat.
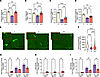 Figure 3
Reductions in skeletal muscle mass induced by semaglutide are blunted by ketone ester co-therapy. (A–D) Weights of the quadriceps, soleus, gastrocnemius, and tibialis anterior muscles were measured after 3 weeks of treatment (n = 6–13; data were obtained from experiments performed on male C57BL/6N and C57BL/6J mice). (E) Representative images of gastrocnemius muscle cross sections stained with wheat germ agglutinin. Scale bars: 400 μm; zoom, ×1.5. (F) Quantification of mean myocyte cross-sectional area in E. Data presented in E and F were obtained from experiments performed on male C57BL/6N mice. (G–I) Total calorie consumption (G), calories from drink consumption (H), and calories from food consumption (I) at 7, 14, and 21 days after initiation of the study protocol. Data presented in G–I were obtained from experiments performed on male C57BL/6J mice. Groups of mice are represented as vehicle (V), semaglutide (S), and semaglutide combined with ketone ester (S+K). Comparisons between 2 groups were conducted using an unpaired, nonparametric Mann-Whitney test. For comparisons among 3 groups, 1-way ANOVA was performed followed by Tukey’s multiple-comparison test (*P < 0.05; **P < 0.01; ***P < 0.001; ****P < 0.0001). All data are expressed as mean ± SEM.
Lastly, to ascertain whether increased caloric intake in the semaglutide + ketone ester–treated mice could contribute to skeletal muscle sparing, we placed another cohort of obese mice in a Comprehensive Lab Animal Monitoring System at 7, 14, and 21 days after initiation of the study protocol to measure food and ketone ester consumption in order to ascertain differences in caloric intake between groups. Our data show that after 7 days, semaglutide-treated mice consumed very few calories (Figure 3G), whereas semaglutide + ketone ester–treated mice consumed modestly more calories, derived almost entirely from the ketone ester (Figure 3, H and I). Despite the differences in caloric intake between groups at this time point, lean muscle mass was not different between groups, suggesting that increased caloric intake in the semaglutide + ketone ester–treated mice was not contributing to skeletal muscle sparing in this group. In agreement with this, at days 14 and 21, when we observed the most muscle loss in semaglutide-treated mice, these mice had an overall higher caloric intake compared with semaglutide + ketone ester–treated mice (Figure 3I). Based on this, we conclude that the effects of the ketone ester in protecting skeletal muscle mass are likely not secondary to an elevated caloric intake.
Semaglutide treatment of obese mice results in reduced BDH1 and SCOT expression in skeletal muscle. Given our recent findings that semaglutide treatment results in a downregulation of β-hydroxybutyrate dehydrogenase 1 (BDH1) expression in cardiac muscle and that this contributes to the loss of cardiac muscle mass (11), we speculated that this also occurs in skeletal muscle. To investigate this, we assessed BDH1 expression in gastrocnemius muscle from mice from all 3 treatment groups euthanized at 3 weeks after treatment. Consistent with our previous findings (11), we show that Bdh1 transcript levels and BDH1 protein expression were significantly downregulated in skeletal muscle from mice treated with semaglutide (Figure 4, A and C). Additionally, we found that the rate-limiting ketolytic enzyme succinyl-CoA:3-ketoacid-CoA transferase (SCOT; gene nomenclature: Oxct1) was significantly downregulated at both the protein and mRNA levels in semaglutide-treated mice (Figure 4, B and C). Importantly, semaglutide-induced downregulation of both enzymes was blunted by co-administration of ketone esters, and protein abundance remained at baseline levels (Figure 4, A–C). Building on previous findings that BDH1 expression is required to maintain skeletal muscle mitochondrial function and support energy stability during caloric restriction and nutrient scarcity (14), along with recent reports linking downregulation of Oxct1 and Bdh1 to mitochondrial dysfunction in sarcopenia (26, 27), we propose that reduced BDH1 and SCOT expression may contribute to semaglutide-induced skeletal muscle loss and thus represent a key mechanism through which ketone ester supplementation preserves muscle mass.
 Figure 4
Semaglutide-induced loss of the ketolytic enzymes BDH1 and SCOT in gastrocnemius tissue is prevented by ketone ester co-therapy. (A and B) RT-qPCR data for Bdh1 and Oxct1 transcript expression in gastrocnemius tissue relative to Rpl32 and Ywhaz (n = 6–13). (C) Representative immunoblot of gastrocnemius BDH1 and SCOT expression and total protein stain. Lysates from gastrocnemius muscle samples taken from groups of mice are represented as vehicle (V), semaglutide (S), or semaglutide combined with ketone ester (S+K). Total protein staining of the membrane is shown as a loading control. Data presented in A–C were obtained from experiments performed on male C57BL/6N and C57BL/6J mice. (D–F) Blood ketone levels were measured at 7 (D), 14 (E), and 21 (F) days after initiation of the study protocol. Data presented in D–F were obtained from experiments performed on male C57BL/6J mice. For comparisons among 3 groups, 1-way ANOVA was performed followed by Tukey’s multiple-comparison test (*P < 0.05; **P < 0.01; ***P < 0.001; ****P < 0.0001). All data are expressed as mean ± SEM. Bdh1, β-hydroxybutyrate dehydrogenase 1; Oxct1, 3-oxoacid CoA-transferase 1; Rpl32, ribosomal protein L32; Ywhaz, tyrosine 3-monooxygenase/tryptophan 5-monooxygenase activation protein ζ.
Given our previous findings in mice with skeletal muscle–specific SCOT1 knockout showing that decreasing of ketolytic enzymes in skeletal muscle is a major driver of elevations in blood ketone levels (28), we also speculated that decreased skeletal muscle ketolytic enzymes could influence circulating blood β-hydroxybutyrate levels. In addition, since the semaglutide-induced dramatic and rapid loss of adipose tissue elevates fatty acids in the blood that act as substrates for the liver to synthesize ketones, we also hypothesized that these skeletal muscle and adipose tissue effects would significantly alter overall blood ketone levels, regardless of ketone ester supplementation. To address this, we measured circulating blood β-hydroxybutyrate levels in all 3 groups of mice at 7, 14, and 21 days after initiation of the study protocol. As expected, likely driven by a combination of the increased adipocyte lipolysis and reduction of skeletal muscle BDH1 and SCOT in semaglutide-treated mice, we observed a high level of ketones at 7 and 14 days after initiation of the weight loss period (Figure 4, D and E). Interestingly, despite ketone ester supplementation in the semaglutide + ketone ester–treated group of mice, we only observed a further elevation in blood β-hydroxybutyrate levels at 14 days of treatment (Figure 4, D and E). Strikingly, at 21 days after treatment, the concentration of β-hydroxybutyrate in the blood returned to baseline levels in both semaglutide- and semaglutide + ketone ester–treated groups of mice (Figure 4F). While we do not provide unequivocal data as to why this occurs, we speculate that the majority of the ketones at days 7 and 14 originated from elevated adipose-derived fatty acids that were used for hepatic ketogenesis and then secreted into the circulation. However, by day 21, adipocyte lipolysis is greatly reduced as BW stabilizes at low levels and there is a reduction in fatty acids available for hepatic ketogenesis. To what extent the reductions in skeletal muscle BDH1 and SCOT levels contribute to these changes in ketone levels in the blood has yet to be fully elucidated.
Transcriptomic analysis of skeletal muscle in semaglutide-treated obese mice in the absence and presence of ketone esters. To more fully characterize the physiological, biological, and cellular changes that were occurring in the skeletal muscle of obese mice treated with semaglutide or semaglutide + ketone ester, we performed transcriptomic analysis using RNA-seq data of gastrocnemius muscle from the 3 relevant groups of mice (vehicle, semaglutide, and semaglutide + ketone ester) at the end of the 3-week treatment period. Firstly, to examine how transcript abundance varied across the 3 treatment groups, we visualized gene-level expression using a triplot (Figure 5A). Statistically significantly altered genes (1-way ANOVA, P < 0.05, fold change > 1.5) are represented in the triplot, where each gene’s position reflects its relative expression across conditions. Genes at the center of the plot exhibit identical expression across all 3 groups, and genes closer to the apex of the triangle are highly expressed in one group compared with the others. Soft clustering identified multiple expression patterns, with 5 more dominant changes observed in clusters consisting of transcripts that were (a) mitochondrial-enriched, (b) muscle contractility–enriched, (c) translation-enriched, (d) proteostasis-enriched, and (e) extracellular matrix–enriched (Figure 5A). Overall, these changes represent important pathways that have previously been shown to be regulated in semaglutide-induced loss of skeletal muscle mass in mice (12).
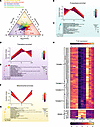 Figure 5
Ketone ester co-therapy prevents semaglutide-induced transcriptomic shifts in skeletal muscle involving proteostasis, translation, and mitochondrial pathways. (A) A triplot depicting log2 fold changes in gene expression across vehicle (V), semaglutide (S), and semaglutide + ketone ester (S+K) treatment groups. Genes highlighted in color are significantly altered (P < 0.05, fold change > 1.5), while gray crosses represent genes that are not significantly altered as assessed by ANOVA analysis. Genes are grouped into 5 distinct clusters based on expression trajectories: mitochondrial-enriched (yellow), muscle contractility–enriched (orange), translation-enriched (purple), proteostasis-enriched (teal), and extracellular matrix–enriched (green). The membership scale denotes how close to the trend each gene falls within the cluster. (B–G) Soft clustering of differentially expressed genes showing relative gene expression trends of interest: proteostasis-enriched cluster (B), translation-enriched cluster (D), and mitochondrial-enriched cluster (F), across V, S, and S+K conditions. Gene Ontology (GO) analysis presented in dot plots is located below differentially expressed gene cluster graphs (C, E, and G). Bubble size reflects the number of genes associated with each GO term; x axis indicates statistical significance as –log10 (P value). (H) Heatmaps of mitochondrial electron transport chain– and atrophy-related genes (n = 3). RNA-seq data were processed via 1-way ANOVA (P < 0.05, fold change ≥ 1.5). Heatmaps were generated using row-wise z score normalization of expression values. Data presented in the figure were obtained from experiments performed on male C57BL/6N mice.
Cluster analysis of skeletal muscle transcripts in semaglutide-treated obese mice in the absence and presence of ketone esters. Three clusters were selected for representation based on their expression profiles, relevance to a previous study (12), and relevance to the treatment response (Figure 5, B, D, and F). These clusters included transcripts that were either suppressed or elevated by semaglutide treatment, with expression patterns returning to vehicle-like levels in the semaglutide + ketone ester group. The gene cluster showing downregulated genes in the semaglutide + ketone ester combination treatment group compared with semaglutide treatment alone contained a proteostasis-enriched set of genes. Particularly, the Gene Ontology term “proteasomal protein catabolic process,” containing 29 genes, suggests that the combination treatment may help with lowering expression of genes related to muscle atrophy and wasting when ketone esters are present (Figure 5, B and C). Genes in the translation-enriched cluster that were elevated in semaglutide-treated mice were enriched for mainly translation-related terms among others (Figure 5, D and E), suggesting that the semaglutide treatment may potentially be causing an increase in transcripts involved in transcription and translational machinery in an apparent futile attempt to compensate for the atrophied muscle. Strikingly, 27% of the total significantly altered genes that were repressed in the semaglutide treatment group (Figure 5F) and normalized in the semaglutide + ketone ester group were categorized in the mitochondrial-enriched cluster (Figure 5G). This trend suggests that ketone ester cotreatment may partially prevent the transcriptomic phenotype induced by semaglutide, maintaining gene expression of many mitochondrial genes at baseline levels.
To extrapolate on the findings of transcript-level trends representing mitochondrial- and proteostasis-related processes, visualization of the expression patterns of genes related to mitochondrial electron transport chain (ETC) and to canonical atrophy was further presented in a heatmap format (Figure 5H). Semaglutide treatment led to broad suppression of ETC gene expression across complexes I–IV, supporting a transcriptional downregulation of mitochondrial bioenergetics. Importantly, ketone ester cotreatment largely preserved expression across these complexes (Figure 5H). Similarly, atrophy-associated transcripts that were elevated by semaglutide were markedly reduced with ketone ester cotreatment, reinforcing the protective effect of ketones on muscle integrity and mitochondrial function (Figure 5H). Together, these data show an expression pattern consistent with dramatic changes induced by semaglutide that are prevented by the addition of the ketone ester treatment in combination with semaglutide.
The putative role of the mitochondria in contributing to the loss of skeletal muscle in semaglutide-treated obese mice. Our transcriptomics analysis in skeletal muscle identified significant changes in transcript levels of genes that encode for proteins involved in the mitochondrial ETC between the 3 treatment groups, suggesting that mitochondrial function and/or number may play an important role in governing the loss of skeletal muscle mass. Indeed, dysfunctional mitochondria are widely accepted as contributing to the etiology of sarcopenia (29), and it has been suggested that this impaired mitochondrial function and the resulting reduction in ATP production limit the cellular processes that are necessary to maintain muscle mass (29). Consistent with these previous findings and our transcriptomic analysis of ETC-related genes, we further show that the protein expression of all 5 of the mitochondrial oxidative phosphorylation (OXPHOS) complexes (I–V) was decreased in the gastrocnemius muscles of semaglutide-treated mice compared with vehicle controls (Figure 6A). In addition, we show that all of the OXPHOS complexes were unaltered in the gastrocnemius muscles of the semaglutide + ketone ester treatment group and were expressed at similar levels to those in the vehicle-treated mice (Figure 6A). Moreover, we also show that the outer mitochondrial membrane voltage-dependent anion channel (VDAC) was decreased in the gastrocnemius muscles of semaglutide-treated mice but was maintained at normal levels in gastrocnemius muscles of semaglutide + ketone ester–treated mice (Figure 6A). Based on the fact that components of complexes I, III, IV, and V are encoded by the mitochondria and VDAC levels can be used as a marker of mitochondrial number (30), these findings suggest reduced mitochondrial number in skeletal muscle of semaglutide-treated mice, which is preserved in the semaglutide + ketone ester–treated group of mice.
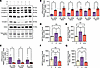 Figure 6
Ketone ester supplementation prevents mitochondrial OXPHOS complex protein expression and gene expression while suppressing atrophy- and stress-associated transcripts in semaglutide-treated muscle. (A) Representative immunoblot analysis of the mitochondrial OXPHOS complexes (I–V) and anti–voltage-dependent anion channel (anti-VDAC) from lysates of gastrocnemius muscle samples taken from groups of mice (C57BL/6N and C57BL/6J) represented as vehicle (V), semaglutide (S), or semaglutide combined with ketone ester (S+K). Total protein staining of the membrane is shown below as a loading control. (B) Gastrocnemius transcript expression of the mitochondrial electron transport–related genes Cox7a1, Atp5e, Uqcrq, Cox20, Smdt1, and Uqcr11 normalized to Rpl32 and Ywhaz, relative to vehicle-treated mice (n = 10–14). Dotted line indicates data for vehicle controls. (C) Gastrocnemius transcript expression of the atrophy-related genes Fbxo32, Trim63, and Tnfrsf12a normalized to Rpl32 and Ywhaz, relative to vehicle-treated mice (n = 5–14). Dotted line indicates data for vehicle controls. Data presented in B and C were obtained from experiments performed on male C57BL/6N and C57BL/6J mice. (D–G) RNA-seq–derived normalized counts for Eef1, Igf1r, Klf15, and Gpx3 (n = 3–5). Data presented in D–G were obtained from experiments performed on male C57BL/6N mice. Comparisons between 2 groups were conducted using an unpaired, nonparametric Mann-Whitney test. For comparisons among 3 groups, 1-way ANOVA was performed followed by Tukey’s multiple-comparison test (*P < 0.05; **P < 0.01). Total normalized counts were compared using 1-way ANOVA followed by Tukey’s multiple-comparison post hoc test. A value of P < 0.05 was considered statistically significant. All data are expressed as mean ± SEM. Cox7a1, cytochrome c oxidase subunit 7A1; Atp5e, ATP5F1E ATP synthase F1 subunit ε; Uqcrq, ubiquinol–cytochrome c reductase, complex III subunit VII; Cox20, cytochrome c oxidase assembly factor; Smdt1, single-pass membrane protein with aspartate-rich tail 1; Uqcr11, ubiquinol–cytochrome c reductase, complex III subunit XI; Fbxo32, atrogin-1; Trim63, muscle RING-finger protein 1; Tnfrsf12a, TNF-related weak inducer of apoptosis; Rpl32, ribosomal protein L32; Ywhaz, tyrosine 3-monooxygenase/tryptophan 5-monooxygenase activation protein ζ; Eef1, eukaryotic elongation factor 1 gene; Igf1r, insulin-like growth factor 1 receptor gene; Klf15, Krüppel-like factor 15 gene; Gpx3, glutathione peroxidase 3 gene.
Although we provide evidence that a reduction in mitochondrial number may account for some of the reduction in skeletal muscle mass in semaglutide-treated mice, it is possible that impaired mitochondrial function also plays a role. Consistent with this, after a literature search to identify mitochondrial proteins that have been shown to be involved in maintaining skeletal muscle mass, we also measured the transcript levels of the gene encoding cytochrome c oxidase subunit 7A1 (Cox7a1), as it was one of the most dramatically decreased transcript levels resulting from semaglutide treatment (Figure 6B) compared with vehicle (dotted black line). COX7A1 is a mitochondrial protein that is necessary for mitochondrial complex IV dimer stabilization and appears to be essential for mediating mitochondrial OXPHOS activity necessary for skeletal muscle maturation, with the loss of COX7A1 resulting in a reduction in skeletal muscle mass and performance (31). Importantly, ketone ester cotreatment of semaglutide-treated obese mice can partially normalize Cox7a1 expression (Figure 6B) and thus may contribute to preserved skeletal muscle mass induced by ketone therapy.
In agreement with OXPHOS activity being reduced in skeletal muscle from obese mice treated with semaglutide, we also show that a cluster of 5 genes that encode mitochondrial proteins that contribute to OXPHOS and ATP production (ATP5F1E ATP synthase F1 subunit ε [Atp5e]; ubiquinol–cytochrome c reductase, complex III subunit VII [Uqcrq]; cytochrome c oxidase assembly factor [Cox20]; single-pass membrane protein with aspartate-rich tail 1 [Smdt1]; and ubiquinol–cytochrome c reductase, complex III subunit XI [Uqcr11]) were reduced in skeletal muscle of semaglutide-treated mice (Figure 6B). This cluster of genes is particularly interesting as they have been shown to be specifically regulated by β-hydroxybutyrylation, an epigenetic modification essential in the reversal of age-associated sarcopenia (17). Importantly, we also show that ketone therapy during semaglutide treatment prevented the decrease in these transcript levels (Figure 6B). Taken together, these data provide compelling evidence that changes in transcript levels of multiple genes that encode mitochondrial proteins that contribute to OXPHOS and ATP production in skeletal muscle may contribute to semaglutide-induced loss of skeletal muscle mass.
The potential involvement of atrophy in the regulation of muscle mass in semaglutide-treated obese mice. As there is strong evidence showing that the mitochondrial dysfunction and increased atrophy in skeletal muscle are tightly coupled (32, 33), we next wanted to investigate whether this was also the case in our semaglutide-treated mice. We observed a significant increase in transcript levels of key atrophic regulatory proteins that govern skeletal muscle atrophy via the ubiquitin-proteasome system, such as atrogin-1 (encoded by the Fbxo32 gene), muscle RING-finger protein 1 (MuRF-1; encoded by the Trim63 gene), and TNF-related weak inducer of apoptosis (TWEAKR; encoded by the Tnfrsf12a gene), in gastrocnemius muscle of semaglutide-treated mice (Figure 6C). Since these proteins are central components of signaling pathways that promote muscle wasting and contribute to skeletal muscle pathology when upregulated (34–36), their increased expression is consistent with the reduced skeletal muscle mass observed in semaglutide-treated mice. Moreover, many of these same genes were also recently shown by another group to be increased in skeletal muscle from mice treated with semaglutide (12), further supporting our findings. More importantly, when mice were treated with semaglutide + ketone esters, the expression of these genes remained at or below control levels (Figure 6C). While these transcriptional data alone are insufficient to definitively conclude that semaglutide activates molecular pathways driving skeletal muscle atrophy or that ketone therapy directly prevents this, these findings align with the physiological changes observed in skeletal muscle mass in these mice.
The potential involvement of additional ketone signaling pathways in the regulation of muscle mass in semaglutide-treated obese mice. A recent study found that semaglutide upregulates transcriptional expression of the eukaryotic elongation factor 1 gene (Eef1) and the insulin-like growth factor 1 receptor gene (Igf1r), which encode proteins associated with protein translation and muscle size (12). Consistent with this, our analysis of normalized RNA-seq counts revealed increased expression of both of these genes in semaglutide-treated mice, which was attenuated by co-administration of ketone esters (Figure 6, D and E). The aforementioned study also found that the Krüppel-like factor 15 gene (Klf15), which encodes a key regulator of muscle protein balance that is upregulated during muscle atrophy, is increased with semaglutide treatment (12). In agreement with this, we observed a trend toward elevated Klf15 transcript levels in semaglutide-treated mice, an effect that was abrogated with ketone ester cotreatment (Figure 6F). Additionally, the glutathione peroxidase 3 (Gpx3) gene, which encodes a protein involved in the glutathione antioxidant pathway, was previously shown to be upregulated by semaglutide (12). We similarly found a significant increase in Gpx3 expression in semaglutide-treated mice, which was reversed with ketone ester co-administration (Figure 6G). Together, these findings suggest that the semaglutide-induced changes in protein balance as well as oxidative stress are completely normalized in the presence of ketones esters.


