
Research ArticleAIDS/HIVImmunologyInfectious disease
Open Access |  10.1172/jci.insight.208375
T cell responses shape infant SIV reservoirs and postintervention control after AAV9-eCD4-Ig and latency reversal
Jairo A. Fonseca,1,2 Alexis C. King,1 Kaleaha S. Davis,1 Daniel O’Hagan,3 Adrian Khoei,4 Lucas Alves Britto Da Costa,3 Camryn Cockerham,1 Mackenzie Cottrell,4 Stephanie Ehnert,5 Jennifer S. Wood,5,6 Michael D. Alpert,7 Matthew R. Gardner,3 Jeffrey D. Lifson,8 Maud Mavigner,1,2,5 Mauricio A. Martins,3 and Ann Chahroudi1,2,5
1Department of Pediatrics, Emory University School of Medicine, Atlanta, Georgia, USA.
2Center for Childhood Infections and Vaccines, Children’s Healthcare of Atlanta and Emory University, Atlanta, Georgia, USA.
3Department of Immunology and Microbiology, The Herbert Wertheim UF Scripps Institute for Biomedical Innovation & Technology, Jupiter, Florida, USA.
4Division of Pharmacotherapy and Experimental Therapeutics, Eshelman School of Pharmacy, University of North Carolina at Chapel Hill, Chapel Hill, North Carolina, USA.
5Emory National Primate Research Center, Emory University, Atlanta, Georgia, USA.
6Department of Pathology and Laboratory Medicine, Emory University School of Medicine, Atlanta, Georgia, USA.
7Emmune Inc., Cambridge, Massachusetts, USA.
8AIDS and Cancer Virus Program, Frederick National Laboratory for Cancer Research, Frederick, Maryland, USA.
Address for correspondence. Ann Chahroudi, 1750 Haygood Dr. NE, Atlanta, Georgia 30322, USA. Phone: 404.727.9209; Email: ann.m.chahroudi@emory.edu.
Find articles by Fonseca, J. in: PubMed | Google Scholar
1Department of Pediatrics, Emory University School of Medicine, Atlanta, Georgia, USA.
2Center for Childhood Infections and Vaccines, Children’s Healthcare of Atlanta and Emory University, Atlanta, Georgia, USA.
3Department of Immunology and Microbiology, The Herbert Wertheim UF Scripps Institute for Biomedical Innovation & Technology, Jupiter, Florida, USA.
4Division of Pharmacotherapy and Experimental Therapeutics, Eshelman School of Pharmacy, University of North Carolina at Chapel Hill, Chapel Hill, North Carolina, USA.
5Emory National Primate Research Center, Emory University, Atlanta, Georgia, USA.
6Department of Pathology and Laboratory Medicine, Emory University School of Medicine, Atlanta, Georgia, USA.
7Emmune Inc., Cambridge, Massachusetts, USA.
8AIDS and Cancer Virus Program, Frederick National Laboratory for Cancer Research, Frederick, Maryland, USA.
Address for correspondence. Ann Chahroudi, 1750 Haygood Dr. NE, Atlanta, Georgia 30322, USA. Phone: 404.727.9209; Email: ann.m.chahroudi@emory.edu.
Find articles by King, A. in: PubMed | Google Scholar
1Department of Pediatrics, Emory University School of Medicine, Atlanta, Georgia, USA.
2Center for Childhood Infections and Vaccines, Children’s Healthcare of Atlanta and Emory University, Atlanta, Georgia, USA.
3Department of Immunology and Microbiology, The Herbert Wertheim UF Scripps Institute for Biomedical Innovation & Technology, Jupiter, Florida, USA.
4Division of Pharmacotherapy and Experimental Therapeutics, Eshelman School of Pharmacy, University of North Carolina at Chapel Hill, Chapel Hill, North Carolina, USA.
5Emory National Primate Research Center, Emory University, Atlanta, Georgia, USA.
6Department of Pathology and Laboratory Medicine, Emory University School of Medicine, Atlanta, Georgia, USA.
7Emmune Inc., Cambridge, Massachusetts, USA.
8AIDS and Cancer Virus Program, Frederick National Laboratory for Cancer Research, Frederick, Maryland, USA.
Address for correspondence. Ann Chahroudi, 1750 Haygood Dr. NE, Atlanta, Georgia 30322, USA. Phone: 404.727.9209; Email: ann.m.chahroudi@emory.edu.
Find articles by Davis, K. in: PubMed | Google Scholar
1Department of Pediatrics, Emory University School of Medicine, Atlanta, Georgia, USA.
2Center for Childhood Infections and Vaccines, Children’s Healthcare of Atlanta and Emory University, Atlanta, Georgia, USA.
3Department of Immunology and Microbiology, The Herbert Wertheim UF Scripps Institute for Biomedical Innovation & Technology, Jupiter, Florida, USA.
4Division of Pharmacotherapy and Experimental Therapeutics, Eshelman School of Pharmacy, University of North Carolina at Chapel Hill, Chapel Hill, North Carolina, USA.
5Emory National Primate Research Center, Emory University, Atlanta, Georgia, USA.
6Department of Pathology and Laboratory Medicine, Emory University School of Medicine, Atlanta, Georgia, USA.
7Emmune Inc., Cambridge, Massachusetts, USA.
8AIDS and Cancer Virus Program, Frederick National Laboratory for Cancer Research, Frederick, Maryland, USA.
Address for correspondence. Ann Chahroudi, 1750 Haygood Dr. NE, Atlanta, Georgia 30322, USA. Phone: 404.727.9209; Email: ann.m.chahroudi@emory.edu.
Find articles by O’Hagan, D. in: PubMed | Google Scholar
1Department of Pediatrics, Emory University School of Medicine, Atlanta, Georgia, USA.
2Center for Childhood Infections and Vaccines, Children’s Healthcare of Atlanta and Emory University, Atlanta, Georgia, USA.
3Department of Immunology and Microbiology, The Herbert Wertheim UF Scripps Institute for Biomedical Innovation & Technology, Jupiter, Florida, USA.
4Division of Pharmacotherapy and Experimental Therapeutics, Eshelman School of Pharmacy, University of North Carolina at Chapel Hill, Chapel Hill, North Carolina, USA.
5Emory National Primate Research Center, Emory University, Atlanta, Georgia, USA.
6Department of Pathology and Laboratory Medicine, Emory University School of Medicine, Atlanta, Georgia, USA.
7Emmune Inc., Cambridge, Massachusetts, USA.
8AIDS and Cancer Virus Program, Frederick National Laboratory for Cancer Research, Frederick, Maryland, USA.
Address for correspondence. Ann Chahroudi, 1750 Haygood Dr. NE, Atlanta, Georgia 30322, USA. Phone: 404.727.9209; Email: ann.m.chahroudi@emory.edu.
Find articles by Khoei, A. in: PubMed | Google Scholar
1Department of Pediatrics, Emory University School of Medicine, Atlanta, Georgia, USA.
2Center for Childhood Infections and Vaccines, Children’s Healthcare of Atlanta and Emory University, Atlanta, Georgia, USA.
3Department of Immunology and Microbiology, The Herbert Wertheim UF Scripps Institute for Biomedical Innovation & Technology, Jupiter, Florida, USA.
4Division of Pharmacotherapy and Experimental Therapeutics, Eshelman School of Pharmacy, University of North Carolina at Chapel Hill, Chapel Hill, North Carolina, USA.
5Emory National Primate Research Center, Emory University, Atlanta, Georgia, USA.
6Department of Pathology and Laboratory Medicine, Emory University School of Medicine, Atlanta, Georgia, USA.
7Emmune Inc., Cambridge, Massachusetts, USA.
8AIDS and Cancer Virus Program, Frederick National Laboratory for Cancer Research, Frederick, Maryland, USA.
Address for correspondence. Ann Chahroudi, 1750 Haygood Dr. NE, Atlanta, Georgia 30322, USA. Phone: 404.727.9209; Email: ann.m.chahroudi@emory.edu.
Find articles by Alves Britto Da Costa, L. in: PubMed | Google Scholar
1Department of Pediatrics, Emory University School of Medicine, Atlanta, Georgia, USA.
2Center for Childhood Infections and Vaccines, Children’s Healthcare of Atlanta and Emory University, Atlanta, Georgia, USA.
3Department of Immunology and Microbiology, The Herbert Wertheim UF Scripps Institute for Biomedical Innovation & Technology, Jupiter, Florida, USA.
4Division of Pharmacotherapy and Experimental Therapeutics, Eshelman School of Pharmacy, University of North Carolina at Chapel Hill, Chapel Hill, North Carolina, USA.
5Emory National Primate Research Center, Emory University, Atlanta, Georgia, USA.
6Department of Pathology and Laboratory Medicine, Emory University School of Medicine, Atlanta, Georgia, USA.
7Emmune Inc., Cambridge, Massachusetts, USA.
8AIDS and Cancer Virus Program, Frederick National Laboratory for Cancer Research, Frederick, Maryland, USA.
Address for correspondence. Ann Chahroudi, 1750 Haygood Dr. NE, Atlanta, Georgia 30322, USA. Phone: 404.727.9209; Email: ann.m.chahroudi@emory.edu.
Find articles by Cockerham, C. in: PubMed | Google Scholar
1Department of Pediatrics, Emory University School of Medicine, Atlanta, Georgia, USA.
2Center for Childhood Infections and Vaccines, Children’s Healthcare of Atlanta and Emory University, Atlanta, Georgia, USA.
3Department of Immunology and Microbiology, The Herbert Wertheim UF Scripps Institute for Biomedical Innovation & Technology, Jupiter, Florida, USA.
4Division of Pharmacotherapy and Experimental Therapeutics, Eshelman School of Pharmacy, University of North Carolina at Chapel Hill, Chapel Hill, North Carolina, USA.
5Emory National Primate Research Center, Emory University, Atlanta, Georgia, USA.
6Department of Pathology and Laboratory Medicine, Emory University School of Medicine, Atlanta, Georgia, USA.
7Emmune Inc., Cambridge, Massachusetts, USA.
8AIDS and Cancer Virus Program, Frederick National Laboratory for Cancer Research, Frederick, Maryland, USA.
Address for correspondence. Ann Chahroudi, 1750 Haygood Dr. NE, Atlanta, Georgia 30322, USA. Phone: 404.727.9209; Email: ann.m.chahroudi@emory.edu.
Find articles by Cottrell, M. in: PubMed | Google Scholar
1Department of Pediatrics, Emory University School of Medicine, Atlanta, Georgia, USA.
2Center for Childhood Infections and Vaccines, Children’s Healthcare of Atlanta and Emory University, Atlanta, Georgia, USA.
3Department of Immunology and Microbiology, The Herbert Wertheim UF Scripps Institute for Biomedical Innovation & Technology, Jupiter, Florida, USA.
4Division of Pharmacotherapy and Experimental Therapeutics, Eshelman School of Pharmacy, University of North Carolina at Chapel Hill, Chapel Hill, North Carolina, USA.
5Emory National Primate Research Center, Emory University, Atlanta, Georgia, USA.
6Department of Pathology and Laboratory Medicine, Emory University School of Medicine, Atlanta, Georgia, USA.
7Emmune Inc., Cambridge, Massachusetts, USA.
8AIDS and Cancer Virus Program, Frederick National Laboratory for Cancer Research, Frederick, Maryland, USA.
Address for correspondence. Ann Chahroudi, 1750 Haygood Dr. NE, Atlanta, Georgia 30322, USA. Phone: 404.727.9209; Email: ann.m.chahroudi@emory.edu.
Find articles by Ehnert, S. in: PubMed | Google Scholar
1Department of Pediatrics, Emory University School of Medicine, Atlanta, Georgia, USA.
2Center for Childhood Infections and Vaccines, Children’s Healthcare of Atlanta and Emory University, Atlanta, Georgia, USA.
3Department of Immunology and Microbiology, The Herbert Wertheim UF Scripps Institute for Biomedical Innovation & Technology, Jupiter, Florida, USA.
4Division of Pharmacotherapy and Experimental Therapeutics, Eshelman School of Pharmacy, University of North Carolina at Chapel Hill, Chapel Hill, North Carolina, USA.
5Emory National Primate Research Center, Emory University, Atlanta, Georgia, USA.
6Department of Pathology and Laboratory Medicine, Emory University School of Medicine, Atlanta, Georgia, USA.
7Emmune Inc., Cambridge, Massachusetts, USA.
8AIDS and Cancer Virus Program, Frederick National Laboratory for Cancer Research, Frederick, Maryland, USA.
Address for correspondence. Ann Chahroudi, 1750 Haygood Dr. NE, Atlanta, Georgia 30322, USA. Phone: 404.727.9209; Email: ann.m.chahroudi@emory.edu.
Find articles by
Wood, J.
in:
PubMed
|
Google Scholar
|

1Department of Pediatrics, Emory University School of Medicine, Atlanta, Georgia, USA.
2Center for Childhood Infections and Vaccines, Children’s Healthcare of Atlanta and Emory University, Atlanta, Georgia, USA.
3Department of Immunology and Microbiology, The Herbert Wertheim UF Scripps Institute for Biomedical Innovation & Technology, Jupiter, Florida, USA.
4Division of Pharmacotherapy and Experimental Therapeutics, Eshelman School of Pharmacy, University of North Carolina at Chapel Hill, Chapel Hill, North Carolina, USA.
5Emory National Primate Research Center, Emory University, Atlanta, Georgia, USA.
6Department of Pathology and Laboratory Medicine, Emory University School of Medicine, Atlanta, Georgia, USA.
7Emmune Inc., Cambridge, Massachusetts, USA.
8AIDS and Cancer Virus Program, Frederick National Laboratory for Cancer Research, Frederick, Maryland, USA.
Address for correspondence. Ann Chahroudi, 1750 Haygood Dr. NE, Atlanta, Georgia 30322, USA. Phone: 404.727.9209; Email: ann.m.chahroudi@emory.edu.
Find articles by Alpert, M. in: PubMed | Google Scholar
1Department of Pediatrics, Emory University School of Medicine, Atlanta, Georgia, USA.
2Center for Childhood Infections and Vaccines, Children’s Healthcare of Atlanta and Emory University, Atlanta, Georgia, USA.
3Department of Immunology and Microbiology, The Herbert Wertheim UF Scripps Institute for Biomedical Innovation & Technology, Jupiter, Florida, USA.
4Division of Pharmacotherapy and Experimental Therapeutics, Eshelman School of Pharmacy, University of North Carolina at Chapel Hill, Chapel Hill, North Carolina, USA.
5Emory National Primate Research Center, Emory University, Atlanta, Georgia, USA.
6Department of Pathology and Laboratory Medicine, Emory University School of Medicine, Atlanta, Georgia, USA.
7Emmune Inc., Cambridge, Massachusetts, USA.
8AIDS and Cancer Virus Program, Frederick National Laboratory for Cancer Research, Frederick, Maryland, USA.
Address for correspondence. Ann Chahroudi, 1750 Haygood Dr. NE, Atlanta, Georgia 30322, USA. Phone: 404.727.9209; Email: ann.m.chahroudi@emory.edu.
Find articles by Gardner, M. in: PubMed | Google Scholar
1Department of Pediatrics, Emory University School of Medicine, Atlanta, Georgia, USA.
2Center for Childhood Infections and Vaccines, Children’s Healthcare of Atlanta and Emory University, Atlanta, Georgia, USA.
3Department of Immunology and Microbiology, The Herbert Wertheim UF Scripps Institute for Biomedical Innovation & Technology, Jupiter, Florida, USA.
4Division of Pharmacotherapy and Experimental Therapeutics, Eshelman School of Pharmacy, University of North Carolina at Chapel Hill, Chapel Hill, North Carolina, USA.
5Emory National Primate Research Center, Emory University, Atlanta, Georgia, USA.
6Department of Pathology and Laboratory Medicine, Emory University School of Medicine, Atlanta, Georgia, USA.
7Emmune Inc., Cambridge, Massachusetts, USA.
8AIDS and Cancer Virus Program, Frederick National Laboratory for Cancer Research, Frederick, Maryland, USA.
Address for correspondence. Ann Chahroudi, 1750 Haygood Dr. NE, Atlanta, Georgia 30322, USA. Phone: 404.727.9209; Email: ann.m.chahroudi@emory.edu.
Find articles by Lifson, J. in: PubMed | Google Scholar
1Department of Pediatrics, Emory University School of Medicine, Atlanta, Georgia, USA.
2Center for Childhood Infections and Vaccines, Children’s Healthcare of Atlanta and Emory University, Atlanta, Georgia, USA.
3Department of Immunology and Microbiology, The Herbert Wertheim UF Scripps Institute for Biomedical Innovation & Technology, Jupiter, Florida, USA.
4Division of Pharmacotherapy and Experimental Therapeutics, Eshelman School of Pharmacy, University of North Carolina at Chapel Hill, Chapel Hill, North Carolina, USA.
5Emory National Primate Research Center, Emory University, Atlanta, Georgia, USA.
6Department of Pathology and Laboratory Medicine, Emory University School of Medicine, Atlanta, Georgia, USA.
7Emmune Inc., Cambridge, Massachusetts, USA.
8AIDS and Cancer Virus Program, Frederick National Laboratory for Cancer Research, Frederick, Maryland, USA.
Address for correspondence. Ann Chahroudi, 1750 Haygood Dr. NE, Atlanta, Georgia 30322, USA. Phone: 404.727.9209; Email: ann.m.chahroudi@emory.edu.
Find articles by Mavigner, M. in: PubMed | Google Scholar
1Department of Pediatrics, Emory University School of Medicine, Atlanta, Georgia, USA.
2Center for Childhood Infections and Vaccines, Children’s Healthcare of Atlanta and Emory University, Atlanta, Georgia, USA.
3Department of Immunology and Microbiology, The Herbert Wertheim UF Scripps Institute for Biomedical Innovation & Technology, Jupiter, Florida, USA.
4Division of Pharmacotherapy and Experimental Therapeutics, Eshelman School of Pharmacy, University of North Carolina at Chapel Hill, Chapel Hill, North Carolina, USA.
5Emory National Primate Research Center, Emory University, Atlanta, Georgia, USA.
6Department of Pathology and Laboratory Medicine, Emory University School of Medicine, Atlanta, Georgia, USA.
7Emmune Inc., Cambridge, Massachusetts, USA.
8AIDS and Cancer Virus Program, Frederick National Laboratory for Cancer Research, Frederick, Maryland, USA.
Address for correspondence. Ann Chahroudi, 1750 Haygood Dr. NE, Atlanta, Georgia 30322, USA. Phone: 404.727.9209; Email: ann.m.chahroudi@emory.edu.
Find articles by Martins, M. in: PubMed | Google Scholar
1Department of Pediatrics, Emory University School of Medicine, Atlanta, Georgia, USA.
2Center for Childhood Infections and Vaccines, Children’s Healthcare of Atlanta and Emory University, Atlanta, Georgia, USA.
3Department of Immunology and Microbiology, The Herbert Wertheim UF Scripps Institute for Biomedical Innovation & Technology, Jupiter, Florida, USA.
4Division of Pharmacotherapy and Experimental Therapeutics, Eshelman School of Pharmacy, University of North Carolina at Chapel Hill, Chapel Hill, North Carolina, USA.
5Emory National Primate Research Center, Emory University, Atlanta, Georgia, USA.
6Department of Pathology and Laboratory Medicine, Emory University School of Medicine, Atlanta, Georgia, USA.
7Emmune Inc., Cambridge, Massachusetts, USA.
8AIDS and Cancer Virus Program, Frederick National Laboratory for Cancer Research, Frederick, Maryland, USA.
Address for correspondence. Ann Chahroudi, 1750 Haygood Dr. NE, Atlanta, Georgia 30322, USA. Phone: 404.727.9209; Email: ann.m.chahroudi@emory.edu.
Find articles by
Chahroudi, A.
in:
PubMed
|
Google Scholar
|
Published September 24, 2026 - More info
JCI Insight. 2026;11(21):e208375. https://doi.org/10.1172/jci.insight.208375.
© 2026 Fonseca et al. This work is licensed under the Creative Commons Attribution 4.0 International License. To view a copy of this license, visit http://creativecommons.org/licenses/by/4.0/.
Received: April 24, 2026; Accepted: September 21, 2026

-
Results
Study design and cohort characteristics. To evaluate a combined latency reversal and immune-mediated clearance strategy, we orally infected 20 infant macaques with SIVmac251 and initiated ART at week 3 after infection (Figure 1). Intervention animals (n = 10) received AAV9-delivered eCD4-IgG1, a broadly neutralizing immunoadhesin targeting the viral envelope, at ART initiation, followed by the SMAC mimetic AZD5582. Control animals (n = 10) received ART alone. eCD4-IgG1 administration timing was selected based on evidence that the first 4 weeks after birth are optimal for AAV-mediated antibody gene transfer, yielding the lowest frequency of ADA responses in rhesus macaques (21). The rh-eCD4-IgG1 transgene encoded a short-hinge variant designed to avoid misfolding from an unpaired hinge cysteine (Supplemental Figure 1; supplemental material available online with this article; https://doi.org/10.1172/jci.insight.208375DS1).
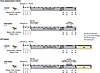 Figure 1
Study design and intervention regimen. Twenty infant rhesus macaques were orally challenged with SIVmac251 at 4 weeks of age and randomly assigned to intervention or control groups (n = 10 per group), and then allocated to a dose optimization cohort (n = 8; 4 per group) or an ATI cohort (n = 12; 6 per group). All time points are weeks after infection. All animals initiated ART at week 3 (gray shading); plasma viral load (PVL) was monitored weekly through week 6 and biweekly thereafter. Intervention animals received AAV9 encoding eCD4-IgG1 (2.5 × 10¹² genome copies kg–1) at week 3, followed by 6 weekly doses of the latency reversal agent AZD5582 beginning at week 40; control animals received ART alone. Dose optimization animals were euthanized during or after AZD5582 administration, with time-matched control animals euthanized at corresponding time points. In the ATI cohort, ART was interrupted 4 weeks after completion of the AZD5582 regimen (tan shading); animals were euthanized a mean of 18 weeks after ATI, with paired control animals euthanized at matched time points. Created with BioRender.com.
The study employed a sequential 2-cohort design. An initial dose optimization cohort (n = 4 intervention, n = 4 control) established a tolerable AZD5582 regimen, which was then applied to an analytical treatment interruption (ATI) cohort (n = 6 intervention, n = 6 control). AZD5582 dosing began at week 40 after infection in both cohorts; however, only the ATI cohort discontinued ART at week 50 to assess the impact of the interventions on post-ART viral control. Groups did not differ significantly in any baseline characteristic including age at infection, sex, Mamu-A*01 status, number of SIV inoculations, and pre-ART viral loads (Table 1 and Supplemental Table 1).
AZD5582 dose optimization. Prior studies showed that the AZD5582 dose sufficient for latency reversal in adult macaques was less effective in infants (17). Pharmacokinetic (PK) modeling predicted that an infant dose of 0.3 mg/kg would achieve a peak plasma concentration (Cmax) and total drug exposure (AUC) comparable to those observed in adults with the 0.1 mg/kg dose (Supplemental Figure 2). Because the model was built on idealized infant macaque parameters and could not fully account for biological variability in key parameters such as volume of distribution, we established a dose optimization cohort to evaluate tolerability prior to the ATI study. Weekly dosing at 0.3 mg/kg (n = 2) or 0.25 mg/kg (n = 2) produced severe cumulative toxicity, including systemic inflammation, respiratory failure, and multiorgan injury (Supplemental Table 2), leading to euthanasia (n = 3) or treatment discontinuation (n = 1) after 5–7 doses, indicating that repeated exposure-matched dosing was not tolerated in infants, possibly due to cumulative immune activation.
We therefore implemented a modified regimen consisting of a 0.25 mg/kg loading dose followed by 5 weekly maintenance doses of 0.2 mg/kg. Although this regimen was not predicted to precisely match the exposures at 0.3 mg/kg, modeled Cmax and AUC remained within the adult target range (Supplemental Figure 2). This regimen, selected for tolerability rather than precise adult PK matching, was well-tolerated in all ATI cohort animals (n = 6) without severe adverse events over the treatment course.
AAV9-mediated eCD4-IgG1 expression. To minimize the impact of preexisting maternally transferred AAV9 antibodies on eCD4-IgG1 expression, infant macaques were screened at 1–2 weeks of age for AAV9-specific neutralizing antibodies. Of 60 infants evaluated, 41 exhibited less than 50% neutralization and were eligible for enrollment (Figure 2A). Three weeks after infection, concurrent with ART initiation, intervention animals across both cohorts (n = 10) received intramuscular co-formulated AAV9-rh-eCD4-IgG1 and AAV9-TPST-2, while control animals (n = 10) received ART alone. TPST-2 promotes eCD4-IgG tyrosine sulfation required for optimal gp120 engagement (22). Plasma eCD4-IgG1 concentrations were monitored weekly for 3 weeks and biweekly thereafter to assess transgene expression kinetics and durability.
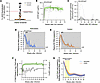 Figure 2
AAV9-mediated eCD4-IgG1 expression and effects on plasma viremia. (A) Anti–AAV9-neutralizing antibody screening at birth by HEK293T transduction inhibition (1:10 serum dilution). Each symbol represents an individual animal (n = 60 screened). Animals enrolled in the study (n = 20) are shown in orange and the red dashed line denotes the acceptance threshold (<50% neutralization). (B and C) Longitudinal serum eCD4-IgG1 concentration (B) and anti-drug antibody responses (C) in intervention animals (n = 10) after AAV9-eCD4-IgG1 administration at week 3 after SIV infection. Solid green and black lines indicate the mean eCD4-IgG1 concentration and ADA response, respectively, with shaded areas indicating ± SEM with individual animal trajectories in gray. (D and E) Plasma SIV RNA kinetics on a log10 scale in intervention (D) and control (E) animals (n = 10 per group) from infection through ART-mediated viral suppression. Solid blue and orange lines indicate the mean plasma SIV RNA levels in the intervention and control groups, respectively, with corresponding shaded areas indicating ± SEM. Gray lines represent individual animal trajectories. Gray shading denotes the ART period, and the dotted horizontal line indicates the assay limit of detection (60 copies/mL). The dashed vertical line in D indicates the time of AAV9-eCD4-IgG1 administration. (F) Fold difference in plasma viral load between groups, shown on a log10 ratio scale with axis labels expressed as signed fold change (negative values denote lower viremia in the intervention group; the reference value is ± 1). Open symbols are fold differences of geometric means ± pooled SEM of the log10 difference. Mean serum eCD4-IgG1 concentration (green, ± SEM) is overlaid on the right y axis. (G) Model-estimated plasma viral load trajectories derived from mixed-effect models with natural cubic splines. Lines represent estimated marginal means of log10 plasma viral load for intervention (blue) and control (orange) animals, with shaded areas indicating 95% CIs. Yellow highlighting denotes time intervals in which viral load was significantly lower in the intervention group after FDR correction (P < 0.05).
AAV9-eCD4-IgG1 administration produced rapid transgene expression in all intervention animals (Figure 2B and Supplemental Figure 3). eCD4-IgG1 became detectable between 4 and 6 weeks after infection (mean 4.6 ± 0.84 weeks) and increased gradually thereafter, reaching a plateau by approximately 17 weeks after infection. Plateau onset was identified by fitting linear regression models to log10-transformed cohort mean plasma eCD4-IgG1 concentrations over time and by defining the earliest week at which the regression slope was no longer significantly different from zero over the subsequent observation window. Stable eCD4-IgG1 concentrations (geometric mean 9.97 μg/mL; geometric SD 1.97) were maintained from week 17 through the last follow-up (weeks 44–70 after infection). Pharmacokinetic properties at the individual animal level are summarized in Supplemental Table 3.
Anti–eCD4-IgG1 responses were detected in 7 of 10 animals (Figure 2C and Supplemental Figure 3), with substantial inter-animal variability in peak ADA magnitude (range 0–0.86; median 0.035 absorbance at 450 nm [A450]). ADA responses were predominantly low in magnitude; only 2 animals exhibited peak ADA levels greater than 0.3 A450 (RTp23 and RVp23), and only 1 animal (RTp23) showed persistent ADA expression, defined as detectable ADA at 2 or more consecutive measurements. In RTp23, plasma eCD4-IgG1 fell to undetectable levels during persistent ADA and recovered after ADA response resolution (Supplemental Figure 3). ADA responses in the remaining animals were transient or of insufficient magnitude to be associated with reduced eCD4-IgG1 levels.
Kinetics of viral suppression with ART with or without AAV9-eCD4-IgG1. Plasma viral loads peaked at 2–3 weeks after infection with similar median peak viremia between groups (intervention 7.28, control 7.23 log10 copies/mL; P = 0.943). Viral kinetics from infection until suppression are shown in Figure 2, D and E, and Supplemental Figures 4 and 5. To assess whether eCD4-IgG1 expression influenced viremia after ART initiation, fold-differences in plasma viral loads between groups from week 3 to week 36 after infection were examined (Figure 2F). At baseline prior to ART (week 3), plasma viral loads were comparable between groups (log10 difference: –0.013 ± 0.28; fold difference: 1.03). After the emergence of detectable plasma eCD4-IgG1, intervention animals exhibited lower viremia than controls, with the greatest difference observed at week 8 (log10 difference: –0.76 ± 0.17; 5.8-fold lower).
To more rigorously characterize the effect of circulating eCD4-IgG1 on viremia, we employed longitudinal mixed-effect modeling with natural cubic splines to capture nonlinear viral decay kinetics while accounting for inter-animal variability. Time was the dominant effect (F4,352.10 = 534.28, P < 0.001), reflecting progressive ART-mediated suppression in both groups. There was no evidence for a sustained overall difference in plasma viral loads between the groups across the postintervention to week 36 period (main effect of group, P = 0.369), although the group × time interaction was suggestive of diverging viral load trajectories (F4,352.10 = 2.30, P = 0.059; Supplemental Table 4). FDR-corrected post hoc comparisons of model-estimated marginal means identified a transient period of accelerated viral decay in eCD4-IgG1 recipients during weeks 5–12 after infection (Figure 2G), with the largest difference at week 10 (0.54 log10; 3.5-fold lower than controls; 95% CI 1.39–8.62; FDR-adjusted P = 0.008). Differences diminished by week 14 and remained nonsignificant thereafter (all FDR-adjusted P > 0.20), consistent with convergence of viral suppression under continued ART.
AZD5582-induced latency reversal. After sustained viral suppression, intervention animals (n = 10) received AZD5582 to assess SIV latency reversal in the presence of circulating eCD4-IgG1 and during continued ART. At baseline (4 weeks before AZD5582 administration), median plasma viral loads were comparable between groups (intervention: 13.0 copies/mL, IQR 11.0–22.5; control: 13.0 copies/mL, IQR 3.0–45.5; Figure 3A). Latency reversal was defined as viremia exceeding 60 copies/mL at any post-baseline time point measured by ultrasensitive assay.
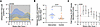 Figure 3
AZD5582 induces latency reversal in infant macaques during suppressive ART. (A) Longitudinal ultrasensitive plasma viremia in AZD5582-treated intervention (n = 10) and control (n = 10) infant macaques over weeks relative to the first AZD5582 dose (vertical red line). Plasma viral load is plotted on a log10 scale. Solid blue and orange lines indicate group means for intervention and control animals, respectively, with corresponding shaded areas indicating ± SEM. The dotted horizontal line denotes the assay limit of detection (3 copies/mL). (B) Per-animal geometric mean ultrasensitive plasma viremia across AZD5582-phase time points from baseline through week 7. Each symbol represents an individual animal; groups were compared using a 2-tailed Mann-Whitney U test. (C) Week-by-week fold difference in on-ART viremia between intervention and control groups. Symbols indicate ratios of geometric mean viral loads, with 95% CIs derived from Welch’s unequal-variance t test on ln-transformed values and back-transformed to the ratio scale; consequently, CIs are asymmetric around the point estimates. Values above the dotted horizontal line at y = 1 indicate higher viremia in the intervention group, consistent with latency reversal. Time points with P < 0.05 are indicated.
After AZD5582 administration, latency reversal (>60 copies/mL) was observed in 8 of 10 intervention animals (80%) compared with spontaneous viral blips above the same threshold in 7 of 10 untreated controls (70%) sampled at equivalent time points. However, latency reversal events were significantly more frequent in intervention animals, occurring at 42.1% of post-baseline time points (24/57) versus 20.3% in controls (14/69; χ2 test, P = 0.014). Notably, 36% of control blips (5/14) originated from a single animal (RQl23), suggesting that spontaneous rebound in the control group was largely driven by 1 outlier. Geometric mean on-ART viremia across the AZD5582 treatment period was significantly higher in the intervention than in the control group (48.9 vs. 12.7 copies/mL; P = 0.0147; Figure 3B). Week-by-week analysis similarly demonstrated higher geometric mean viremia in AZD5582-treated animals (Figure 3C), with marked differences at week 1 (fold increase: 9.45, 95% CI 1.51–59.24; P = 0.019), 2 (fold increase: 11.77, 95% CI 2.10–65.88; P = 0.008), and 4 (fold increase: 6.79, 95% CI 1.56–29.56; P = 0.013). Within the intervention group, the dose optimization cohort exhibited higher peak viral loads (median 1,633 copies/mL; IQR 65–3,800) and a higher incidence of latency reversal (4/4 infants) than the ATI cohort (peak viremia median 215 copies/mL; IQR 83–708; incidence of latency reversal 4/6 infants), consistent with higher AZD5582 doses leading to greater viral reactivation.
Partial postintervention control after ATI. Four weeks after the final AZD5582 dose, animals underwent ATI. Plasma SIV RNA was measured 3 times weekly during the first 5 weeks and weekly thereafter through week 20. All animals developed detectable viral rebound within 2–3 weeks (Figure 4, A and B). Pre-ATI frequencies of intact proviruses in blood, lymph node, and rectal mononuclear cells were similar between the groups (Supplemental Figure 6).
 Figure 4
Virological rebound and reservoir dynamics after analytical treatment interruption. (A and B) Longitudinal plasma SIV RNA after ATI in intervention (A) and control (B) animals, plotted on a log10 scale. Gray lines indicate individual animal trajectories; the 2 intervention animals exhibiting partial postintervention viral control are shown in red in A. Solid blue and orange lines indicate group means for intervention and control animals, respectively, with corresponding shaded areas indicating ± SEM. The dotted horizontal line denotes the assay limit of detection (60 copies/mL). (C) Per-animal geometric mean plasma SIV RNA across the ATI period (weeks 0–20), grouped by treatment and controller status: controllers (red), intervention non-controllers (filled blue), and control non-controllers (open orange). Groups were compared using a 2-tailed Mann-Whitney U test. (D) Kaplan-Meier estimates of time to detectable viral rebound, defined as plasma SIV RNA >60 copies/mL. Groups were compared using the log-rank (Mantel-Cox) test; the hazard ratio for intervention relative to control was estimated using the observed-minus-expected method. (E) Per-animal geometric mean plasma SIV RNA across the ATI period, grouped by controller status: controllers (red) and non-controllers (filled black, intervention; open black, control). (F) Intact SIV proviral DNA in PBMCs at week 13 after ATI, expressed as intact proviral DNA assay copies per 106 PBMCs. (G) Fold-change in intact SIV proviral DNA from pre-ATI baseline to week 13 after ATI; the dotted horizontal line indicates no change (fold change = 1). In A–D, n = 6 animals per group; in E–G, n = 2 controllers and n = 10 non-controllers. Horizontal lines indicate group geometric means in C and E and group medians in F and G.
To evaluate the group-level effect of combined AAV9-eCD4-IgG1 and AZD5582 treatment on viral burden during ATI, we compared each animal’s geometric mean plasma viral load over weeks 0–20. No difference was detected between the intervention and control groups (Figure 4C; Mann-Whitney P = 0.82). Time to detectable rebound, defined as plasma SIV RNA greater than 60 copies/mL, likewise did not differ (median 14 days in each group; log-rank P = 0.44; HR 1.42, 95% CI 0.45–4.47; Figure 4D).
Although no group-level effect was detected, individual trajectories varied. All 6 control animals maintained plasma viremia between 103 and 107 copies/mL throughout ATI, whereas 2 of 6 intervention animals had episodes of undetectable plasma viremia after initial rebound and maintained lower set points from approximately week 14. For exploratory analyses, animals were classified post hoc as controllers or non-controllers, with non-controllers defined by plasma viremia sustained above 1,000 copies/mL throughout ATI, a threshold selected after inspection of the observed trajectories. The 2 controllers were both intervention animals; the 10 non-controllers comprised 4 intervention and 6 control animals. As expected from this outcome-based classification, plasma viral burden during ATI was lower in the controllers (geometric mean, 2,746 versus 38,585 copies/mL, approximately 14-fold lower; Figure 4E). Given the small number of controllers (n = 2), no formal hypothesis testing was performed for any controller versus non-controller comparison.
We next examined whether the controller phenotype was associated with differences in the intact viral reservoir after ATI. At week 13 after ATI, the 2 controllers had 35.53 and 43.99 intact SIV proviral copies per 106 PBMCs, whereas the 10 non-controllers had a median of 740.2 (IQR 493.6–1,627; Figure 4F), approximately 17- to 21-fold higher than the individual controller values. From the pre-ATI baseline to week 13 after ATI, intact proviral DNA increased in 9 of 10 non-controllers (median 15-fold increase; IQR 5.16–25.93) but remained stable or decreased in both controllers (fold changes of 0.50 and 0.99; Figure 4G). Thus, in this exploratory post hoc analysis, secondary viral control in 2 intervention animals was accompanied by maintenance or reduction of the intact proviral reservoir after ATI, suggesting that immune mechanisms controlling viremia and reservoir size may contribute to partial postintervention control.
Viral features of postintervention control. Before examining antiviral immune responses, we assessed whether post-ATI viral control was associated with virological or pharmacological variables that preceded or were independent of the intervention. The 2 controllers did not exhibit lower systemic viral burden early in infection; both had pre-ART plasma viremia near the upper end of the non-controller range (Figure 5A). During suppressive ART from weeks 4–36 after infection, however, both controllers had cumulative plasma viremia among the lowest in the cohort (Figure 5B).
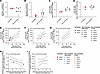 Figure 5
Virological predictors of posttreatment control after analytical treatment interruption. (A–D) Comparison of controllers (n = 2) and non-controllers (n = 10) for geometric mean plasma viral load during early infection (A; weeks 1–3 after infection) and suppressive ART (B; weeks 4–36 after infection), and for intact SIV proviral DNA at ART initiation in PBMCs (C) and lymph node mononuclear cells (LNMCs) (D). Data are presented descriptively. (E–G) Linear regression of geometric mean plasma viral load during suppressive ART against intact SIV proviral DNA in PBMCs at week 13 after ATI, across all ATI cohort animals (E; n = 12) and separately in intervention (F; n = 6) and control (G; n = 6) animals. Solid lines indicate linear regression fits, and dashed lines indicate 95% CI bounds. (H and I) Partial Pearson’s correlations between geometric mean plasma viremia during the AZD5582 dosing phase in intervention animals or matched time points in control animals and intact SIV proviral DNA in PBMCs at week 13 after ATI, adjusted for geometric mean plasma viral load during suppressive ART, in intervention (H; n = 6) and control (I; n = 6) animals. Pearson’s correlation coefficients (r), coefficients of determination (R2), and exact P values are shown in E–G; partial correlation coefficients (r) and exact P values are shown in H and I. Each symbol represents an individual animal identified in the figure key. In A–E, controllers are shown in red, intervention non-controllers as filled black symbols, and control non-controllers as open black symbols. In F–I, controllers are shown in red, intervention non-controllers as filled blue symbols, and control non-controllers as open orange symbols.
Within the intervention group, AZD5582-associated viremia and cumulative eCD4-IgG1 exposure were similar in controllers and non-controllers (Supplemental Table 5). Intact SIV proviral DNA measured after intervention but before ATI in peripheral blood, lymph nodes, and rectal mononuclear cells also showed no clear separation (Supplemental Figure 7). These observations provide no evidence that the controller phenotype resulted from lower early plasma viremia, greater eCD4-IgG1 exposure, or a smaller intact reservoir immediately before ATI.
One preintervention measurement showed a distinct pattern. At week 3 after infection, before ART initiation, both controllers had fewer intact SIV proviruses in peripheral blood than any non-controller (4,653 and 5,019 vs. a non-controller median of 9,937 copies per 106 PBMCs; Figure 5C). In contrast, intact proviral DNA in lymph node mononuclear cells at the same time point was comparable between the controllers and non-controllers (Figure 5D). Thus, lower peripheral-blood intact proviral burden before ART was observed in both animals that later developed secondary viral control, although the small, post hoc–defined controller group precludes conclusions regarding prediction or causality.
To generate hypotheses regarding the association of these virological characteristics with post-ART viremia, we performed linear regression analyses across the entire cohort. We evaluated baseline predictors of 2 complementary measures of postintervention control: the geometric mean of plasma viremia during ATI and the levels of intact SIV proviral DNA in PBMCs at week 13 of ATI (Supplemental Table 6). Geometric mean viremia during initial suppression (weeks 4–36 after infection) was a strong predictor of intact proviral DNA during ATI (Figure 5E). By contrast, no virological variables predicted plasma viremia during ATI; however, intact SIV proviral DNA during ATI was strongly rank-correlated with the geometric mean of ATI viremia (Spearman’s ρ = 0.78, P = 0.005), indicating concordance between these measures. Accordingly, intact SIV proviral DNA was used as the primary outcome measure in subsequent analyses to identify determinants of postintervention control. Using this approach, we again found the geometric mean of viremia during initial suppression to be a robust predictor of intact SIV DNA during ATI in both the intervention (Figure 5F) and control groups (Figure 5G).
Given this strong influence of initial viral decay on ATI outcomes, we used partial correlation analyses to determine whether AZD5582-induced viremia was associated with postintervention reservoir size, independently of suppression-phase viremia, motivated by a possible association in the initial linear regression analyses, which suggested a possible association between AZD5582-induced viremia and ATI reservoir size (Supplemental Table 6; R2 = 0.32, P = 0.055). After adjusting for suppression-phase viremia, AZD5582-induced viremia was strongly inversely correlated with intact proviral reservoir size in intervention animals (r = –0.76, R2 = 0.58, P = 0.061; Figure 5H). No such correlation was observed in control animals when considering residual viremia over the matched timeframe (r = 0.48, R2 = 0.23, P = 0.338; Figure 5I), revealing a divergent treatment-dependent pattern in reservoir dynamics.
Collectively, these analyses identified viremia during initial ART suppression as the strongest predictor of intact proviral reservoir size during ATI, potentially implicating antiviral immune responses in viral control both at ART initiation and after ART withdrawal. Despite the limited cohort size, partial correlation analyses adjusting for baseline viremia suggested a treatment-dependent effect of AZD5582-induced on-ART viremia and smaller ATI reservoir size in the intervention group. However, comparisons of controllers versus non-controllers within the intervention group (n = 2 vs. n = 4) were underpowered to detect differences in AZD5582-induced latency reversal.
Immunological correlates of postintervention control. Because the lower pre-ART intact SIV proviral burden in the controllers could reflect an antiviral T cell response that also contributed to post-ATI control, we next examined SIV-specific T cell responses in relation to virological outcome. All animals were negative for Mamu-B*08 and Mamu-B*17. Mamu-A*01 positivity was similarly distributed across outcome groups, occurring in 1 of 2 controllers (RLq23) and 5 of 10 non-controllers (RIv23, RAl23, ROm23, RQl23, and RTk23). Thus, the MHC-I alleles examined did not segregate with post-ATI outcome, although the small number of controllers limits this interpretation. Both controllers received AZD5582 plus AAV9-eCD4-IgG1, whereas the non-controller group included 4 intervention animals and 6 ART-only controls. Therefore, intervention assignment and post-ATI outcome were not independent in this cohort. Because only 2 animals met the criteria for control, comparisons between outcome groups were considered descriptive, and no statistical tests were performed. SIV-specific CD4+ and CD8+ T cell responses were evaluated immediately before ATI, 4 weeks after completion of AZD5582 treatment, and at week 13 after ATI. Samples with poststimulation viability below 40% were excluded from the analyses; therefore, the number of evaluable animals varied by assay and time point.
We first quantified Gag-specific CD8+ T cells by the activation-induced marker (AIM) assay. Before ATI, both controllers had higher frequencies of Gag-specific CD8+ T cells than all evaluable non-controllers (3.17% and 5.07% vs. 0% to 1.12% in non-controllers, n = 6; Figure 6A). The lower controller value was approximately 2.8-fold greater than the highest non-controller value. This separation was no longer apparent at week 13 after ATI, when controller frequencies of 1.67% and 5.46% fell within the non-controller range of 0% to 8.83% (median 2.82%, non-controller n = 7). At this time point, non-controllers were viremic, whereas controllers had undetectable plasma viremia. The increased Gag-specific responses in several non-controllers were therefore consistent with stimulation by ongoing antigen exposure during ATI.
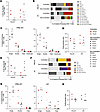 Figure 6
SIV-specific T cell frequency and function in relation to postintervention control. (A) Frequencies of SIVmac239 Gag-specific CD8+ T cells measured by AIM assay before and 13 weeks after ATI. (B) Mean distribution of 15 Boolean combinations of IFN-γ, TNF-α, CD107a, and granzyme K among function-positive Gag-specific CD8+ T cells; proportions sum to 100%. (C) Proportions of Gag-specific CD8+ T cells expressing 1–4 functions per animal before ATI and 13 weeks after ATI. (D) CD8+ T cell polyfunctionality index calculated as described by Larsen et al. (55). (q = 1; range, 0.250–1.0). (E) Frequencies of SIVmac239 Gag-specific CD4+ T cells measured by AIM assay at the indicated time points. (F) Mean distribution of 7 Boolean combinations of IFN-γ, TNF-α, and CD107a among function-positive Gag-specific CD4+ T cells; proportions sum to 100%. (G) Proportions of Gag-specific CD4+ T cells expressing 1–3 functions per animal before ATI and 13 weeks after ATI. (H) CD4+ T cell polyfunctionality index (range, 0.333–1.0). Because the index is normalized to the number of functions, values in D and H are not directly comparable. In A, C–E, G, and H, controllers are red, intervention non-controllers are filled black, and ART-only non-controllers are open black. Symbols represent individual animals. Horizontal lines indicate non-controller medians. No statistical comparisons were performed because only 2 animals met criteria for postintervention control.
We next evaluated the functional composition of Gag-specific CD8+ T cell responses by intracellular cytokine staining. Boolean gates were used to define the proportion of total cytokine-producing CD8+ T cells expressing combinations of IFN-γ, TNF-α, CD107a, and granzyme K (Figure 6B). Before ATI, multifunctional subsets were generally enriched in the controllers (n = 2) compared with non-controllers (n = 10). The average proportions in the 2 controllers and the non-controller group were 8.9% and 2.4%, respectively, for IFN-γ+TNF-α+ cells; 15.9% and 8.9% for TNF-α+CD107a+ cells; and 6.0% and 2.1% for IFN-γ+TNF-α+CD107a+ cells. TNF-α+CD107a+granzyme K+ cells accounted for 0.5% of the response in controllers and 0.1% in non-controllers. Conversely, monofunctional CD107a+ cells represented a smaller proportion of the response in controllers than in non-controllers, with averages of 14.5% and 26.4%, respectively. At week 13 after ATI (n = 2 and n = 6), no functional subset showed consistent separation by outcome.
Grouping responding cells by the number of simultaneously expressed functions showed a similar pattern at the individual-animal level (Figure 6C). Before ATI, single-function cells comprised 54.4% and 65.9% of the responses in the 2 controllers, lower than in 9 of 10 non-controllers (median 76.6%; range 62.3%–100%). Two-function cells accounted for 37.4% and 25.8% of controller responses, versus a non-controller range of 0% to 29.1%, and cells expressing 3 or more functions accounted for 8.2% and 8.3% compared with a non-controller median of 2.6%. Notably, 1 intervention-arm non-controller, RJv23, fell within the controller range across all functional categories, indicating that pre-ATI CD8+ T cell polyfunctionality alone was insufficient for post-ATI control.
Polyfunctionality indices were used to summarize the response quality for each animal (Figure 6D). Before ATI, the 2 controllers had indices of 0.356 and 0.385, exceeding 9 of 10 non-controllers (non-controller median 0.317; range 0.250–0.378), with RJv23 being the exception with an index of 0.378 falling between the 2 controllers. At week 13 after ATI, controller values encompassed much of the non-controller range. RLq23 had the highest index among 8 animals evaluated (0.429), whereas RHq23 had an index of 0.322, below the non-controller median (0.325) Thus, within-controller variability exceeded the apparent difference between outcome groups.
We next assessed whether Gag-specific CD4+ T cell responses differed by post-ATI outcome. By AIM assay, response magnitude did not clearly distinguish controllers from non-controllers at either time point (Figure 6E). Before ATI, controller frequencies (4.31% and 1.76%) overlapped those of non-controllers (median 1.34%; range 0.58%–3.51%; n = 6). At week 13 after ATI, controller frequencies were 0% and 1.24%, both at or below the non-controller median of 2.34% (range 0%–6.20%; n = 7). As in the CD8+ T cell analysis, ongoing viremia in non-controllers that was absent in the controllers may have contributed to differences in antigen-driven responses during ATI.
Beyond response magnitude, we characterized the Gag-specific CD4+ T cell responses by intracellular cytokine staining for IFN-γ, TNF-α, and CD107a (Figure 6F). Dual-function subsets constituted a greater average proportion of the pre-ATI response in controllers than in non-controllers: 40.4% vs. 10.8% for IFN-γ+TNF-α+ and 10.7% versus 3.3% for TNF-α+CD107a+ cells. Conversely, monofunctional CD107a+ cells represented an average of 5.8% of the controller response versus 34.0% in the non-controllers. Triple-function cells showed less separation (4.9% controllers vs. 2.4% non-controllers). At week 13 after ATI, no functional subset consistently differed by virological outcome. Grouping by number of functions showed a similar pattern (Figure 6G): before ATI, single-function cells averaged 41.8% in controllers versus 78.5% in non-controllers and dual-function cells averaged 53.4% versus 19.1%, respectively. Controller polyfunctionality indices were 0.652 and 0.435 compared with a non-controller median of 0.417 (range 0.334–0.486; Figure 6H). At week 13 after ATI, the controller indices of 0.593 and 0.436 fell within the non-controller range of 0.366 to 0.651.
The pre-ATI differences in CD4+ T cell functionality were not consistent between the 2 controllers. RLq23 had the most functionally diverse CD4+ T cell response in the cohort, with single-function cells comprising 11.5% of the response and a polyfunctionality index of 0.652, representing the most extreme values among all 12 animals. In contrast, single-function cells comprised 72.0% of the response in RHq23, whose polyfunctionality index of 0.435 was within the non-controller range (Figure 6, G and H). Thus, the apparent outcome-associated differences in average CD4+ T cell functionality were driven predominantly by 1 controller, and neither the magnitude nor the functional composition of the CD4+ T cell responses consistently distinguished both controllers from the non-controllers.
Finally, we compared T cell responses by treatment group rather than post-ATI outcome. Before ATI, triple-function CD4+ T cell responses were higher in animals that received AZD5582 plus AAV9-eCD4-IgG1 than in ART-only controls, whereas no corresponding difference was observed for CD8+ T cells (Supplemental Figure 8).
Taken together, these data indicate that the animals that went on to control viral replication had mounted the largest and most functionally diverse Gag-specific CD8+ T cell responses in the cohort at the time of ART interruption, and these distinctions were not maintained once viral replication resumed. The corresponding CD4+ T cell responses did not differ in magnitude and differed in quality only in 1 of the 2 controllers, suggesting that the immunological features associated with postintervention control in this study were largely restricted to the CD8+ T cell compartment. Given that only 2 animals met criteria for control, these associations are hypothesis generating.


