
Research ArticleImmunology
Open Access |  10.1172/jci.insight.195868
Reduced CCL/Be-specific CD4+ T cells in CCL3-deficient or peptide-MHCII CAR-T cell–treated mice
Michael T. Falta,1 Masoom Raza,1 Caley J. Nevienski,1 Tonya M. Brunetti,2 Rui Fu,3 Rebecca M. Tucker,1 Joseph M. Gaballa,1 Faiz Minhajuddin,1 Kibrom M. Alula,1 Alberto Dinarello,1 Douglas G. Mack,1 Allison K. Martin,1 Joseph C. Onyiah,1 Michael Yarnell,4,5 Prashanth Francis,4 Terry J. Fry,4,5 Lisa A. Maier,1,6 Andrew P. Fontenot,1 Charles A. Dinarello,1 and Shaikh M. Atif1
1Department of Medicine and
2Department of Immunology and Microbiology, University of Colorado Anschutz, Aurora, Colorado, USA.
3New York Genome Center, New York, New York, USA.
4Department of Pediatrics, University of Colorado Anschutz Medical Campus, Aurora, Colorado, USA.
5Center for Cancer and Blood Disorders, Children’s Hospital Colorado, Aurora, Colorado, USA.
6Department of Medicine, National Jewish Health, Denver, Colorado, USA.
Address correspondence to: Shaikh Muhammad Atif, Division of Infectious Diseases (B164), University of Colorado Anschutz, 12700 East 19th Ave., Aurora, Colorado, 80045, USA. Phone: 303.724.7206; Email: shaikh.atif@cuanschutz.edu.
Authorship note: MTF and MR contributed equally to this work.
Find articles by Falta, M. in: PubMed | Google Scholar
1Department of Medicine and
2Department of Immunology and Microbiology, University of Colorado Anschutz, Aurora, Colorado, USA.
3New York Genome Center, New York, New York, USA.
4Department of Pediatrics, University of Colorado Anschutz Medical Campus, Aurora, Colorado, USA.
5Center for Cancer and Blood Disorders, Children’s Hospital Colorado, Aurora, Colorado, USA.
6Department of Medicine, National Jewish Health, Denver, Colorado, USA.
Address correspondence to: Shaikh Muhammad Atif, Division of Infectious Diseases (B164), University of Colorado Anschutz, 12700 East 19th Ave., Aurora, Colorado, 80045, USA. Phone: 303.724.7206; Email: shaikh.atif@cuanschutz.edu.
Authorship note: MTF and MR contributed equally to this work.
Find articles by Raza, M. in: PubMed | Google Scholar
1Department of Medicine and
2Department of Immunology and Microbiology, University of Colorado Anschutz, Aurora, Colorado, USA.
3New York Genome Center, New York, New York, USA.
4Department of Pediatrics, University of Colorado Anschutz Medical Campus, Aurora, Colorado, USA.
5Center for Cancer and Blood Disorders, Children’s Hospital Colorado, Aurora, Colorado, USA.
6Department of Medicine, National Jewish Health, Denver, Colorado, USA.
Address correspondence to: Shaikh Muhammad Atif, Division of Infectious Diseases (B164), University of Colorado Anschutz, 12700 East 19th Ave., Aurora, Colorado, 80045, USA. Phone: 303.724.7206; Email: shaikh.atif@cuanschutz.edu.
Authorship note: MTF and MR contributed equally to this work.
Find articles by Nevienski, C. in: PubMed | Google Scholar
1Department of Medicine and
2Department of Immunology and Microbiology, University of Colorado Anschutz, Aurora, Colorado, USA.
3New York Genome Center, New York, New York, USA.
4Department of Pediatrics, University of Colorado Anschutz Medical Campus, Aurora, Colorado, USA.
5Center for Cancer and Blood Disorders, Children’s Hospital Colorado, Aurora, Colorado, USA.
6Department of Medicine, National Jewish Health, Denver, Colorado, USA.
Address correspondence to: Shaikh Muhammad Atif, Division of Infectious Diseases (B164), University of Colorado Anschutz, 12700 East 19th Ave., Aurora, Colorado, 80045, USA. Phone: 303.724.7206; Email: shaikh.atif@cuanschutz.edu.
Authorship note: MTF and MR contributed equally to this work.
Find articles by Brunetti, T. in: PubMed | Google Scholar
1Department of Medicine and
2Department of Immunology and Microbiology, University of Colorado Anschutz, Aurora, Colorado, USA.
3New York Genome Center, New York, New York, USA.
4Department of Pediatrics, University of Colorado Anschutz Medical Campus, Aurora, Colorado, USA.
5Center for Cancer and Blood Disorders, Children’s Hospital Colorado, Aurora, Colorado, USA.
6Department of Medicine, National Jewish Health, Denver, Colorado, USA.
Address correspondence to: Shaikh Muhammad Atif, Division of Infectious Diseases (B164), University of Colorado Anschutz, 12700 East 19th Ave., Aurora, Colorado, 80045, USA. Phone: 303.724.7206; Email: shaikh.atif@cuanschutz.edu.
Authorship note: MTF and MR contributed equally to this work.
Find articles by Fu, R. in: PubMed | Google Scholar
1Department of Medicine and
2Department of Immunology and Microbiology, University of Colorado Anschutz, Aurora, Colorado, USA.
3New York Genome Center, New York, New York, USA.
4Department of Pediatrics, University of Colorado Anschutz Medical Campus, Aurora, Colorado, USA.
5Center for Cancer and Blood Disorders, Children’s Hospital Colorado, Aurora, Colorado, USA.
6Department of Medicine, National Jewish Health, Denver, Colorado, USA.
Address correspondence to: Shaikh Muhammad Atif, Division of Infectious Diseases (B164), University of Colorado Anschutz, 12700 East 19th Ave., Aurora, Colorado, 80045, USA. Phone: 303.724.7206; Email: shaikh.atif@cuanschutz.edu.
Authorship note: MTF and MR contributed equally to this work.
Find articles by Tucker, R. in: PubMed | Google Scholar
1Department of Medicine and
2Department of Immunology and Microbiology, University of Colorado Anschutz, Aurora, Colorado, USA.
3New York Genome Center, New York, New York, USA.
4Department of Pediatrics, University of Colorado Anschutz Medical Campus, Aurora, Colorado, USA.
5Center for Cancer and Blood Disorders, Children’s Hospital Colorado, Aurora, Colorado, USA.
6Department of Medicine, National Jewish Health, Denver, Colorado, USA.
Address correspondence to: Shaikh Muhammad Atif, Division of Infectious Diseases (B164), University of Colorado Anschutz, 12700 East 19th Ave., Aurora, Colorado, 80045, USA. Phone: 303.724.7206; Email: shaikh.atif@cuanschutz.edu.
Authorship note: MTF and MR contributed equally to this work.
Find articles by Gaballa, J. in: PubMed | Google Scholar
1Department of Medicine and
2Department of Immunology and Microbiology, University of Colorado Anschutz, Aurora, Colorado, USA.
3New York Genome Center, New York, New York, USA.
4Department of Pediatrics, University of Colorado Anschutz Medical Campus, Aurora, Colorado, USA.
5Center for Cancer and Blood Disorders, Children’s Hospital Colorado, Aurora, Colorado, USA.
6Department of Medicine, National Jewish Health, Denver, Colorado, USA.
Address correspondence to: Shaikh Muhammad Atif, Division of Infectious Diseases (B164), University of Colorado Anschutz, 12700 East 19th Ave., Aurora, Colorado, 80045, USA. Phone: 303.724.7206; Email: shaikh.atif@cuanschutz.edu.
Authorship note: MTF and MR contributed equally to this work.
Find articles by Minhajuddin, F. in: PubMed | Google Scholar
1Department of Medicine and
2Department of Immunology and Microbiology, University of Colorado Anschutz, Aurora, Colorado, USA.
3New York Genome Center, New York, New York, USA.
4Department of Pediatrics, University of Colorado Anschutz Medical Campus, Aurora, Colorado, USA.
5Center for Cancer and Blood Disorders, Children’s Hospital Colorado, Aurora, Colorado, USA.
6Department of Medicine, National Jewish Health, Denver, Colorado, USA.
Address correspondence to: Shaikh Muhammad Atif, Division of Infectious Diseases (B164), University of Colorado Anschutz, 12700 East 19th Ave., Aurora, Colorado, 80045, USA. Phone: 303.724.7206; Email: shaikh.atif@cuanschutz.edu.
Authorship note: MTF and MR contributed equally to this work.
Find articles by Alula, K. in: PubMed | Google Scholar
1Department of Medicine and
2Department of Immunology and Microbiology, University of Colorado Anschutz, Aurora, Colorado, USA.
3New York Genome Center, New York, New York, USA.
4Department of Pediatrics, University of Colorado Anschutz Medical Campus, Aurora, Colorado, USA.
5Center for Cancer and Blood Disorders, Children’s Hospital Colorado, Aurora, Colorado, USA.
6Department of Medicine, National Jewish Health, Denver, Colorado, USA.
Address correspondence to: Shaikh Muhammad Atif, Division of Infectious Diseases (B164), University of Colorado Anschutz, 12700 East 19th Ave., Aurora, Colorado, 80045, USA. Phone: 303.724.7206; Email: shaikh.atif@cuanschutz.edu.
Authorship note: MTF and MR contributed equally to this work.
Find articles by Dinarello, A. in: PubMed | Google Scholar
1Department of Medicine and
2Department of Immunology and Microbiology, University of Colorado Anschutz, Aurora, Colorado, USA.
3New York Genome Center, New York, New York, USA.
4Department of Pediatrics, University of Colorado Anschutz Medical Campus, Aurora, Colorado, USA.
5Center for Cancer and Blood Disorders, Children’s Hospital Colorado, Aurora, Colorado, USA.
6Department of Medicine, National Jewish Health, Denver, Colorado, USA.
Address correspondence to: Shaikh Muhammad Atif, Division of Infectious Diseases (B164), University of Colorado Anschutz, 12700 East 19th Ave., Aurora, Colorado, 80045, USA. Phone: 303.724.7206; Email: shaikh.atif@cuanschutz.edu.
Authorship note: MTF and MR contributed equally to this work.
Find articles by Mack, D. in: PubMed | Google Scholar
1Department of Medicine and
2Department of Immunology and Microbiology, University of Colorado Anschutz, Aurora, Colorado, USA.
3New York Genome Center, New York, New York, USA.
4Department of Pediatrics, University of Colorado Anschutz Medical Campus, Aurora, Colorado, USA.
5Center for Cancer and Blood Disorders, Children’s Hospital Colorado, Aurora, Colorado, USA.
6Department of Medicine, National Jewish Health, Denver, Colorado, USA.
Address correspondence to: Shaikh Muhammad Atif, Division of Infectious Diseases (B164), University of Colorado Anschutz, 12700 East 19th Ave., Aurora, Colorado, 80045, USA. Phone: 303.724.7206; Email: shaikh.atif@cuanschutz.edu.
Authorship note: MTF and MR contributed equally to this work.
Find articles by Martin, A. in: PubMed | Google Scholar
1Department of Medicine and
2Department of Immunology and Microbiology, University of Colorado Anschutz, Aurora, Colorado, USA.
3New York Genome Center, New York, New York, USA.
4Department of Pediatrics, University of Colorado Anschutz Medical Campus, Aurora, Colorado, USA.
5Center for Cancer and Blood Disorders, Children’s Hospital Colorado, Aurora, Colorado, USA.
6Department of Medicine, National Jewish Health, Denver, Colorado, USA.
Address correspondence to: Shaikh Muhammad Atif, Division of Infectious Diseases (B164), University of Colorado Anschutz, 12700 East 19th Ave., Aurora, Colorado, 80045, USA. Phone: 303.724.7206; Email: shaikh.atif@cuanschutz.edu.
Authorship note: MTF and MR contributed equally to this work.
Find articles by Onyiah, J. in: PubMed | Google Scholar
1Department of Medicine and
2Department of Immunology and Microbiology, University of Colorado Anschutz, Aurora, Colorado, USA.
3New York Genome Center, New York, New York, USA.
4Department of Pediatrics, University of Colorado Anschutz Medical Campus, Aurora, Colorado, USA.
5Center for Cancer and Blood Disorders, Children’s Hospital Colorado, Aurora, Colorado, USA.
6Department of Medicine, National Jewish Health, Denver, Colorado, USA.
Address correspondence to: Shaikh Muhammad Atif, Division of Infectious Diseases (B164), University of Colorado Anschutz, 12700 East 19th Ave., Aurora, Colorado, 80045, USA. Phone: 303.724.7206; Email: shaikh.atif@cuanschutz.edu.
Authorship note: MTF and MR contributed equally to this work.
Find articles by Yarnell, M. in: PubMed | Google Scholar
1Department of Medicine and
2Department of Immunology and Microbiology, University of Colorado Anschutz, Aurora, Colorado, USA.
3New York Genome Center, New York, New York, USA.
4Department of Pediatrics, University of Colorado Anschutz Medical Campus, Aurora, Colorado, USA.
5Center for Cancer and Blood Disorders, Children’s Hospital Colorado, Aurora, Colorado, USA.
6Department of Medicine, National Jewish Health, Denver, Colorado, USA.
Address correspondence to: Shaikh Muhammad Atif, Division of Infectious Diseases (B164), University of Colorado Anschutz, 12700 East 19th Ave., Aurora, Colorado, 80045, USA. Phone: 303.724.7206; Email: shaikh.atif@cuanschutz.edu.
Authorship note: MTF and MR contributed equally to this work.
Find articles by Francis, P. in: PubMed | Google Scholar
1Department of Medicine and
2Department of Immunology and Microbiology, University of Colorado Anschutz, Aurora, Colorado, USA.
3New York Genome Center, New York, New York, USA.
4Department of Pediatrics, University of Colorado Anschutz Medical Campus, Aurora, Colorado, USA.
5Center for Cancer and Blood Disorders, Children’s Hospital Colorado, Aurora, Colorado, USA.
6Department of Medicine, National Jewish Health, Denver, Colorado, USA.
Address correspondence to: Shaikh Muhammad Atif, Division of Infectious Diseases (B164), University of Colorado Anschutz, 12700 East 19th Ave., Aurora, Colorado, 80045, USA. Phone: 303.724.7206; Email: shaikh.atif@cuanschutz.edu.
Authorship note: MTF and MR contributed equally to this work.
Find articles by Fry, T. in: PubMed | Google Scholar
1Department of Medicine and
2Department of Immunology and Microbiology, University of Colorado Anschutz, Aurora, Colorado, USA.
3New York Genome Center, New York, New York, USA.
4Department of Pediatrics, University of Colorado Anschutz Medical Campus, Aurora, Colorado, USA.
5Center for Cancer and Blood Disorders, Children’s Hospital Colorado, Aurora, Colorado, USA.
6Department of Medicine, National Jewish Health, Denver, Colorado, USA.
Address correspondence to: Shaikh Muhammad Atif, Division of Infectious Diseases (B164), University of Colorado Anschutz, 12700 East 19th Ave., Aurora, Colorado, 80045, USA. Phone: 303.724.7206; Email: shaikh.atif@cuanschutz.edu.
Authorship note: MTF and MR contributed equally to this work.
Find articles by Maier, L. in: PubMed | Google Scholar
1Department of Medicine and
2Department of Immunology and Microbiology, University of Colorado Anschutz, Aurora, Colorado, USA.
3New York Genome Center, New York, New York, USA.
4Department of Pediatrics, University of Colorado Anschutz Medical Campus, Aurora, Colorado, USA.
5Center for Cancer and Blood Disorders, Children’s Hospital Colorado, Aurora, Colorado, USA.
6Department of Medicine, National Jewish Health, Denver, Colorado, USA.
Address correspondence to: Shaikh Muhammad Atif, Division of Infectious Diseases (B164), University of Colorado Anschutz, 12700 East 19th Ave., Aurora, Colorado, 80045, USA. Phone: 303.724.7206; Email: shaikh.atif@cuanschutz.edu.
Authorship note: MTF and MR contributed equally to this work.
Find articles by
Fontenot, A.
in:
PubMed
|
Google Scholar
|

1Department of Medicine and
2Department of Immunology and Microbiology, University of Colorado Anschutz, Aurora, Colorado, USA.
3New York Genome Center, New York, New York, USA.
4Department of Pediatrics, University of Colorado Anschutz Medical Campus, Aurora, Colorado, USA.
5Center for Cancer and Blood Disorders, Children’s Hospital Colorado, Aurora, Colorado, USA.
6Department of Medicine, National Jewish Health, Denver, Colorado, USA.
Address correspondence to: Shaikh Muhammad Atif, Division of Infectious Diseases (B164), University of Colorado Anschutz, 12700 East 19th Ave., Aurora, Colorado, 80045, USA. Phone: 303.724.7206; Email: shaikh.atif@cuanschutz.edu.
Authorship note: MTF and MR contributed equally to this work.
Find articles by
Dinarello, C.
in:
PubMed
|
Google Scholar
|
1Department of Medicine and
2Department of Immunology and Microbiology, University of Colorado Anschutz, Aurora, Colorado, USA.
3New York Genome Center, New York, New York, USA.
4Department of Pediatrics, University of Colorado Anschutz Medical Campus, Aurora, Colorado, USA.
5Center for Cancer and Blood Disorders, Children’s Hospital Colorado, Aurora, Colorado, USA.
6Department of Medicine, National Jewish Health, Denver, Colorado, USA.
Address correspondence to: Shaikh Muhammad Atif, Division of Infectious Diseases (B164), University of Colorado Anschutz, 12700 East 19th Ave., Aurora, Colorado, 80045, USA. Phone: 303.724.7206; Email: shaikh.atif@cuanschutz.edu.
Authorship note: MTF and MR contributed equally to this work.
Find articles by Atif, S. in: PubMed | Google Scholar
Published June 9, 2026 - More info
JCI Insight. 2026;11(14):e195868. https://doi.org/10.1172/jci.insight.195868.
© 2026 Falta et al. This work is licensed under the Creative Commons Attribution 4.0 International License. To view a copy of this license, visit http://creativecommons.org/licenses/by/4.0/.
Received: May 21, 2025; Accepted: May 21, 2026

-
Results
Macrophage and DC responses in Be-exposed HLA-DP2–CCL3–/– Tg mice. In CBD, the innate immune mediators CCL3 and CCL4 are produced in the lungs in response to Be exposure (7). To investigate their role in Be-induced innate and adaptive immune responses, we generated CCL3–/– HLA-DP2 Tg mice by crossing HLA-DP2 Tg mice with CCL3–/– mice. CCL3–/– mice are hypomorphic for CCL4 (24), and qPCR and ELISA data confirmed the absence of both CCL3 and CCL4 gene and protein expression (Supplemental Figure 1, A and B; supplemental material available online with this article; https://doi.org/10.1172/jci.insight.195868DS1) in HLA-DP2 CCL3–/– Tg mice exposed to BeO/LPS. To assess the impact of CCL3 and CCL4, we first examined pulmonary macrophages and DCs in WT and CCL3–/– mice following short-term exposure to BeO on days 0, 1, and 2 and LPS on day 2. On day 3, leukocytes in the lung tissues were analyzed after excluding the cells in circulation labeled with intravenously injected anti-CD45 mAb. Both WT and CCL3–/– mice showed a similar frequency and number of MerTK+CD64+ macrophages (Figure 1, A and C) and CD11c+MHCII+ DCs (Figure 1, B and D) in the lungs. Furthermore, CCL3–/– mice showed no differences compared with treated WT mice in lung cDC1 and cDC2 subsets, and their expression of the costimulatory molecule CD86 (Figure 1, E and F). Thus, these data suggest that the absence of CCL3 and CCL4 does not affect the phenotype of these innate immune cells nor their initial response to pulmonary BeO/LPS exposure.
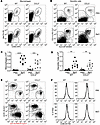 Figure 1
Analysis of innate immune cells in the lungs of HLA-DP2 Tg WT and CCL3-deficient (CCL3–/–) mice. HLA-DP2 Tg WT and CCL3–/– mice were intratracheally exposed to PBS or BeO (100 μg) on days 0, 1, and 2 and LPS (10 μg) on day 2. (A and B) Representative flow cytometric plots show MerTK+CD64+ macrophages (A) and CD11c+HLA-DP+ dendritic cells (DCs) staining (B). (C and D) Graph plots show the number of tissue-specific macrophages (C) and DCs (D) in the lungs 24 hours after the last exposure. (E) XCR1+ (cDC1) and CD11b+ (cDC2) DC subsets were examined in the lungs of PBS- (top) and BeO- (bottom) treated WT and CCL3–/– mice. (F) Histograms show representative expression of CD86 on cDC1 (gray) and cDC2 cells (black). Each data point represents an individual mouse, and values are shown as (mean ± SEM) combined from 2 independent experiments. 1-way ANOVA determined statistical significance. ***P < 0.001, ****P < 0.0001.
Reduced CD4+ T cell responses in BeO-exposed HLA-DP2 Tg mice lacking CCL3. CD4+ T cells play a central role in the pathogenesis of CBD by responding to Be-associated antigens, releasing inflammatory cytokines, and driving lung granuloma formation (25, 26). To assess the absence of CCL3 and CCL4 chemokines on the global CD4+ T cell response, HLA-DP2 Tg WT and CCL3–/– mice were sensitized and boosted with BeO (100 μg) and a single dose of LPS (10 μg). On day 21, both the frequency and number of CD4+ T cells were reduced by more than 50% in the lungs of CCL3–/– mice compared with WT mice (Figure 2A). Furthermore, although the frequency of CD44+ activated CD4+ T cells did not differ from WT mice (Figure 2B), the CCL3–/– mice had a significantly reduced number of these T cells (Figure 2B). In BeO/LPS-exposed CCL3–/– mice, the frequency of Tregs in the lungs was higher compared with WT mice, although this difference did not reach statistical significance (Figure 2C). However, consistent with our previous finding that the Teff/Treg ratio correlates with increased lung inflammation due to Be exposure (8), the Teff/Treg ratio was significantly lower in BeO/LPS-exposed CCL3–/– mice compared with WT controls (Figure 2D).
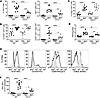 Figure 2
Phenotype of tissue-resident CD4+ T cells in BeO-exposed HLA-DP2 Tg CCL3–/– mice. HLA-DP2 Tg WT and CCL3–/– mice were intratracheally exposed to PBS or BeO (100 μg) on days 0, 1, 2, 14, 15, 18, and 19, and LPS (10 μg) was administered on day 14. Mice were sacrificed on day 21. (A–C) Data plots of isolated lung cells show: (A) the frequency (left) and number (right) of tissue-resident CD4+ T cells, (B) the frequency (left) and number (right) of CD44+ activated CD4+ T cells, and (C) the frequency of FoxP3+CD4+ T cells. (D) Comparison of the Teff/Treg ratio on day 21 of PBS- and BeO/LPS-exposed mice. (E) Histograms illustrate the phenotype of CD4+ T cell proliferation (Ki-67 staining), tissue-resident (CD103, CD69), and activated (CD62L) cells. Solid histograms show PBS-treated WT (light gray) and CCL3–/– (dark gray) mice; lines show BeO-exposed WT (solid line) and CCL3–/– (dotted line) mice. (F) IFN-γ spot-forming units (SFUs) were examined by ELISPOT assay. Each data point represents an individual mouse, and values are shown as (mean ± SEM) combined from 2 independent experiments. 1-way ANOVA determined statistical significance. *P < 0.05, **P < 0.01, ***P < 0.001, ****P < 0.0001.
Next, we assessed whether CCL3 deficiency affected CD4+ T cell proliferation by staining lung cells for Ki-67, a nuclear protein marker of actively dividing cells (27). Be-exposed WT and CCL3–/– mice showed a similar increase in Ki+CD4+ T cells (Figure 2E). We also compared the expression of T cell tissue-resident activation and memory markers in WT and CCL3–/– mice. Compared with PBS-treated controls, both WT and CCL3–/– mice showed a similar loss in CD62L expression and similar increases in CD103 and CD69 expression, confirming their tissue-resident phenotype (Figure 2E). Finally, we quantified the number of IFN-γ–secreting CD4+ T cells in the lungs of WT and CCL3–/– mice exposed to PBS or BeO/LPS. Following exposure, CCL3–/– mice exhibited approximately a 2.5-fold reduction in IFN-γ–secreting cells compared with WT mice, whereas IFN-γ–secreting cells were absent in PBS-treated WT and CCL3–/– mice (Figure 2F). In contrast, purified CD4+ T cells stimulated with the mitogen phytohemagglutinin (PHA) showed no difference between WT and CCL3–/– mice (Supplemental Figure 2), indicating that the reduced IFN-γ response in Be/LPS-exposed CCL3–/– mice is due to the absence of CCL3 and CCL4 rather than a global defect in CD4+ T cell function. Collectively, our data suggest that CCL3 and/or CCL4 are required for a robust CD4+ T cell response in the lungs of BeO-exposed mice.
Reduced pathogenic CD4+ T cell response in the lungs of BeO-exposed CCL3–/– mice at day 12. In our standard 21-day BeO/LPS exposure protocol, CCL3–/– mice showed reduced T cell–specific responses compared with WT mice. To investigate the early effect of Be exposure on CD4+ T cell recruitment and function, HLA-DP2 Tg WT and CCL3–/– mice were analyzed on day 12 using a modified protocol (Supplemental Figure 3A). CCL3–/– mice exposed to BeO on days 0, 1, and 2 and treated with LPS on day 8 showed no difference in the total number of lung cells compared with WT mice (Supplemental Figure 3B), nor was there any difference observed between PBS-exposed WT and CCL3–/– control mice. However, both the frequency and number of CD4+ T cells were reduced in BeO/LPS-exposed CCL3–/– mice compared with WT mice, with no statistically significant differences observed between the treated WT and CCL3–/– mice (Supplemental Figure 3C). Analysis of CD4+ T cells showed a similar number of activated CD44+ CD4+ T cells in the lungs of WT and CCL3–/– mice in response to BeO/LPS (Supplemental Figure 3D).
To assess CD4+ T cell functional responses on day 12, ELISPOT assays were performed on purified CD4+ T cells from BeO/LPS-exposed mice. Following ex vivo stimulation with BeSO4, WT lung CD4+ T cells showed a 5-fold increase in IFN-γ–secreting cells and a 4-fold increase in IL-17A–secreting cells compared with CD4+ T cells isolated from CCL3–/– mice (Supplemental Figure 3, E and F). CD4+ T cells from PBS-exposed WT and CCL3–/– mice did not respond to Be stimulation. Finally, to confirm that reduced T cell responses in CCL3–/– mice were not due to defects in lung T cell homing, we examined expression of the homing receptor CCR7 (C-C chemokine receptor type 7) on tissue-resident CD4+ T cells (28). Flow cytometric analysis revealed similar baseline levels of CCR7 expression in PBS-exposed WT and CCL3–/– mice. Upon BeO exposure, both groups exhibited a comparable increase in CCR7 expression (Supplemental Figure 3, G and H), indicating that CCL3-deficiency does not impair T cell homing.
Next, we examined CD4+ T cell homing in a non-Be inflammatory setting. WT and CCL3–/– mice were exposed to Aspergillus nidulans conidia (1 × 10⁸) via intratracheal administration on day 0, and CD4+ T cell frequencies and numbers were determined on day 14. Both WT and CCL3–/– mice exposed to A. nidulans showed comparable recruitment of CD4+ T cells to the lungs (Supplemental Figure 4, A and B). Together, these findings indicate that CCL3 and CCL4 do not affect CD4+ T cell homing to the lung but rather play an important role in the development of pathogenic CD4+ T cells in CBD.
Absence of CCL/Be-specific CD4+ T cells and cellular aggregates in the lungs of BeO-exposed CCL3–/– mice. BeO exposure induces robust Be-dependent chemokine peptide-specific CD4+ T cell responses in both mice and patients with CBD expressing HLA-DP2 (7, 8). Previously, we also observed a significant enhancement in the chemokine-specific T cell response following exposure to the TLR4 ligand LPS, likely driven by the increased presence of CCL3 and CCL4 as antigens in the lung microenvironment associated with LPS stimulation (7). We hypothesized that mice genetically deficient in CCL3, which also lacks functional CCL4, would fail to develop chemokine-specific T cell responses and have diminished disease pathology. To test this, we used HLA-DP2 tetramers to track HLA-DP2–CCL3/Be and HLA-DP2–CCL4/Be antigen-specific CD4+ T cell responses in HLA-DP2 Tg WT and CCL3–/– mice sensitized and boosted with BeO and a single dose of LPS. Prior to assessing tetramer-binding in vivo, tetramer specificity was validated by staining TCR-transduced hybridomas specific for CCL4/Be or CCL3/Be, as well as lung CD4+ T cells from BeO-exposed mice. CLIP-loaded HLA-DP2 tetramers were used as a negative control to define background staining (Supplemental Figure 5). Representative HLA-DP2 tetramer staining of experimental mice is shown in Figure 3A. In stark contrast to the high frequency and number of HLA-DP2 tetramer-binding CD4+ T cells in BeO-exposed WT mice, there was a pronounced absence of tetramer+ cells in the lungs of CCL3–/– mice and the control mice treated with PBS (Figure 3, B and C).
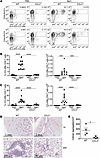 Figure 3
HLA-DP2 tetramer staining of CD4+ T cells in BeO/LPS-exposed WT and CCL3–/– mice. HLA-DP2 Tg WT and CCL3–/– mice were intratracheally exposed to PBS or BeO (100 μg) on days 0, 1, 2, 14, 15, 18, and 19 as well as a single dose of LPS (10 μg) on day 14. Lung cells were examined on day 21. (A) Contour plots show PE-labeled HLA-DP2–CCL3/Be tetramer (top) and HLA-DP2–CCL4/Be tetramer staining (bottom) of tissue-resident CD4+ T cells. (B and C) Frequency (left) and number (right) of HLA-DP2–CCL3-Be tetramer+ (B) and HLA-DP2–CCL4/Be tetramer+ (C) tissue-resident CD4+ T cells. Each data point represents an individual mouse; values are shown as (mean ± SEM) from 2 combined independent experiments. One-way ANOVA determined statistical significance. (D) H&E staining showing low (1X) and high (20X) magnification of lung tissues. (E) Representative quantification of cellular aggregates in WT and CCL3–/– BeO-exposed lungs examined on day 21. A student’s nonparametric 2-tailed t test determined statistical significance. *P < 0.05, ***P < 0.001, ****P < 0.0001.
A key feature of the HLA-DP2 Tg mouse model of CBD is the formation of extensive peribronchovascular cellular infiltrates in the lungs after Be2+ exposure, and the number and size of these aggregates correlate with the dose of Be2+ (8, 29). To determine how the lack of CCL3/4 affects the formation of cellular aggregates, we performed H&E staining on lung tissue from BeO/LPS-exposed mice. Analysis of tissue sections showed greatly reduced peribronchiolar and perivascular mononuclear infiltrates in the lungs of CCL3–/– BeO-treated mice compared with the WT mice (Figure 3D). The cellular aggregates were reduced by more than 8-fold in the CCL3–/– mice as examined in Qupath software (Figure 3E). These data strongly implicate that the adaptive immune response directed against Be-modified CCL3 and CCL4 antigens is critical for the development of lung inflammation in our animal model of CBD.
Pulmonary DCs control the chemokine/Be-specific CD4+ T cell response in the lungs. As noted, pulmonary exposure to Be triggers the release of CCL3 and CCL4, and these proinflammatory chemokines control the adaptive immune response in CBD by providing Be-modified neoantigens (7). To identify the cellular source of CCL3, BeO/LPS-exposed HLA-DP2 Tg WT mice were treated with intratracheal Brefeldin A with either PBS or LPS (10 μg) 4 hours before sacrifice. Intracellular staining of isolated lung cells revealed elevated CCL3 levels in both MerTK+CD64+SigF+CD11chi alveolar macrophages (Figure 4A) and MerTK–CD11c+HLA-DP+ DCs (Figure 4A) compared with other hematopoietic and nonhematopoietic cells (data not shown). Since DCs exhibited higher CCL3 expression and are the most potent antigen-presenting cells (APCs), we investigated whether conventional DCs control CCL3/Be-specific CD4+ T cell responses. Bone marrow chimeric mice were generated by transferring bone marrow cells from HLA-DP2–Zbtb46-DTR CD45.2 Tg mice to HLA-DP2 Tg B6 CD45.1 congenic mice (Figure 4B). Zbtb46 is a zinc finger transcription factor specifically expressed in classical DCs among immune lineages (30, 31). After confirming chimerism 8 weeks after transfer, chimeric mice were exposed to BeO/LPS by the standard protocol and treated either with or without diphtheria toxin (DT, 5 ng/g body weight) every fourth day during the entire exposure regimen, beginning at day –1. At sacrifice, mice treated with DT showed a significant decrease in the frequency (Figure 4C) and number (Figure 4C) of lung CD4+ T cells. Furthermore, the loss of DCs significantly reduced the accumulation of CD44+ effector T cells in the lungs of BeO-exposed mice (Figure 4D). Finally, BeO-exposed mice treated with DT showed a > 2.5-fold decrease in the frequency (Figure 4E) and total number (Figure 4E) of CCL4/Be-specific CD4+ T cells in the lungs as measured by HLA-DP2–CCL4/Be tetramer staining. A similar response for HLA-DP2–CCL3/Be-specific CD4+ T cells would be expected in these mice, given that CCL3- and CCL4-specific CD4+ T cells were comparable in Be-exposed WT mice (Figure 3). Overall, the data suggest an important role for DCs in establishing and maintaining CCL/Be-specific CD4+ T cell responses.
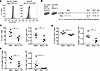 Figure 4
Classical dendritic cells are required for optimal CCL/Be-specific CD4+ T cell responses in BeO-exposed HLA-DP2 Tg mice. (A) Representative histograms show intracellular staining of CCL3 in lung myeloid cells from HLA-DP2 Tg mice after PBS (solid-gray) or BeO/LPS (black line) standard exposure regimen. On day 21, mice were treated with intratracheal brefeldin A and LPS (10 μg) for 4 hours before sacrifice. (B) Diagram illustrates the strategy for assessing the role of conventional dendritic cells in the CCL/Be-specific CD4+ T cell response. Eight weeks after reconstitution, 2 groups (n = 4–5/group) of lethally irradiated HLA-DP2 Tg CD45.1 mice reconstituted with HLA-DP2–Zbtb46-DTR Tg bone marrow cells were exposed to BeO/LPS. The control group received PBS, and the test group was treated with diphtheria toxin (DT, 5 ng/g body weight) every fourth day, beginning at day –1. (C–E) Plots show the frequency (left) and number (right) of tissue-resident CD4+ T cells (C), CD44+ activated CD4+ T cells (D), and HLA-DP2–CCL4/Be tetramer binding CD4+ T cells in the lungs of mice exposed to BeO/LPS (E) and examined on day 21. Data are representative of 2 independent experiments. A nonparametric Student’s t test was used to determine statistical significance. *P < 0.05.
Hematopoietic compartment reconstituted with WT bone marrow restores chemokine/Be-specific CD4+ T cell responses in CCL3–/– BeO-exposed mice. Since macrophages and DCs originate from a myeloid lineage, we further examined the role of the hematopoietic compartment in driving chemokine/Be-specific CD4+ T cell responses in the lungs of BeO-exposed mice. Lethally irradiated HLA-DP2 Tg WT or CCL3–/– mice (both CD45.2) were reconstituted with bone marrow cells obtained from HLA-DP2 Tg CD45.1 congenic mice. After confirming chimerism, the recipient mice were treated with the standard BeO/LPS regimen (Figure 5A) and analyzed on day 21, after excluding cells in circulation labeled with an intravenously injected anti-CD45 mAb. Both WT and CCL3–/– reconstituted mice showed no difference in the accumulation of HLA-DP2–CCL4/Be-binding CD4+ T cells in the lungs of Be-exposed mice (Figure 5, B and F). Additionally, no differences in frequencies were observed in IV-CD45–CD4+ gated tissue-resident CD44+CD69+ T cells (Figure 5, C and G), CD25+FoxP3+ Tregs (Figure 5, D and H), and CD103+CD69+ tissue-resident memory T cells (Figure 5, E and I). Next, ex vivo IFN-γ and IL-2 ELISPOT assays measuring lung T cell responses to BeSO4 stimulation showed no differences between WT and CCL3–/– mice in the number of IFN-γ and IL-2–secreting cells (Figure 5, J and K). Together, these data suggest that cells of hematopoietic origin are the primary cellular sources of CCL3 and CCL4.
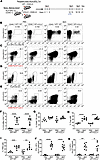 Figure 5
Hematopoietic cells control the CCL/Be-specific CD4+ T cell response in the lungs of BeO-exposed mice. (A) Diagram shows the generation of bone marrow chimera mice. Lethally irradiated HLA-DP2 Tg WT or CCL3–/– mice were reconstituted with bone marrow cells from congenic (CD45.1) HLA-DP2 Tg mice. (B–E) Representative flow cytometric plots show the frequency of CCL4/Be-specific (B), CD44+CD69+ tissue-resident (TR) (C), CD25+FoxP3+ Treg (D), and CD103+CD69+ tissue-resident memory (TRM) (E) CD4+ T cells in the lungs of PBS- and BeO-exposed mice. The recipient mouse strain and treatment received for each column of plots are indicated at the top of B. (F–I) Summary plots of the cell parameters indicated in B–E. (J and K) Data plots show IFN-γ (J) and IL-2 (K) ELISPOT responses as spot-forming units (SFUs) per 100,000 purified CD4+ T cells stimulated overnight with BeSO4 (100 μM). Each data point represents an individual mouse; values are shown as (mean ± SEM) combined from 2 independent experiments. One-way ANOVA determined statistical significance. *P < 0.05, **P < 0.01, ****P < 0.0001.
Bulk RNA-seq reveals heterogeneity in antigen-specific tissue-resident CD4+ T cells in the lungs of BeO-exposed HLA-DP2 Tg mice. Similar to CBD (9), CD4+ T cells accumulate in the alveolar spaces of HLA-DP2 Tg mice following Be exposure (Figure 6A). Many of these T cells recognize neoantigens composed of Be and peptides derived from CCL3 and CCL4 (7), and include both Th1 and Treg CD4+ T cell subsets (8). To explore the transcriptional landscape of CD4+ T cells, including CCL/Be-specific CD4+ T cells, we performed bulk RNA-seq of lung-resident CD4+ T cells from BeO-exposed HLA-DP2 Tg mice to identify unique gene signatures involved in disease pathogenesis that could be therapeutically targeted. We focused on 3 subsets of CD4+ T cells: CD44+ HLA-DP2–CCL4/Be tetramer+ (Tet+, blue), CD44+ HLA-DP2–CCL4/Be tetramer– (Tet–, red), and CD44–HLA-DP2–CCL4/Be tetramer– (DN, green) cells (Figure 6B). Principal component analysis (PCA) of differentially expressed genes separated the 2 CD44+ subsets from the DN population (Figure 6C). However, the Tet+ and Tet– T cell subsets clustered together, suggesting a high degree of overlap in their gene expression profiles despite sorting on a discrete antigen-specific T cell population (Figure 6C). Next, we generated heat maps of the differentially expressed genes in the Tet+, Tet–, and DN populations. Again, considerable overlap in gene expression was observed between Tet+ and Tet– T cells (Figure 6D). The heatmap revealed increased expression of several hundred genes in Tet+ and Tet– CD4+ T cells compared with the DN populations, including genes associated with activation (Pdcd1, Cd44, Il18rap, Cxcr6, Sell, Axl, Ccn4), proliferation (Mki67), and effector function (Ifng, Il17, Il18, Tnf) (Figure 6, E and F).
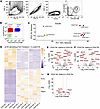 Figure 6
Transcriptional landscape of CD4+ T cells in the lungs of BeO-exposed HLA-DP2 Tg mice. HLA-DP2 Tg mice were intratracheally exposed to BeO (100 μg) on days 0, 1, 2, 14, 15, 18, and 19 and a single dose of LPS (10 μg) on day 14. On day 21, 2 minutes before sacrifice, mice were i.v. injected with anti-mouse CD45 mAb (5 μg/mouse) to distinguish circulating T cells from lung-resident T cells. (A) Gating strategy to identify lung CD4+ T cells after excluding myeloid and B cells in BeO-exposed mice. (B) CD4+ T cell populations, CD44+Tet+ cells (Tet+, blue), CD44+Tet– cells (Tet–, red), and CD44–Tet– cells (DN, green) flow-sorted from the lungs of BeO-exposed mice. (C) Principal component analysis (PCA) plot shows the separation between tissue-resident Tet+ cells (blue), Tet– cells (red), and DN cells (green). (D) Heatmap of upregulated (gold) and downregulated (purple) differentially expressed genes between Tet+ cells, Tet– cells, and DN cells. Each column in the heat map represents a sample collected from sorted CD4+ T cell types isolated from 5 BeO/LPS-exposed mice. (E–G) Volcano plots showing significantly upregulated and downregulated genes in (E) CD44+Tet+ cells compared with CD44–Tet– DN cells, (F) CD44+Tet– cells compared with CD44–Tet– DN cells, and (G) CD44+Tet+ cells compared with CD44+Tet– cells.
To examine whether transcriptional changes were reflected at the protein level, we assessed the expression of selected molecules encoded by genes significantly upregulated in Tet+ and Tet– CD4+ T cells by flow cytometry. HLA-DP2 Tg mice were exposed to the standard BeO/LPS regimen for 21 days, and lung-resident CD4+ T cells were analyzed following HLA-DP2–CCL4/Be tetramer staining. Surface and intracellular staining was performed to measure the expression of PD-1 (Pdcd1), CD44 (Cd44), CD62L (Sell), Ki-67 (Mki67), IFN-γ (Ifng), TNF-α (Tnfa), and IL-17A (Il17a). Flow cytometry plots (Supplemental Figure 6A) and mean fluorescence intensity (MFI) values (Supplemental Figure 6B) demonstrated significant differences in expression of these molecules in Tet+ and Tet– CD4+ T cells compared with DN CD4+ T cells.
Additionally, we directly compared the transcriptional profile of Tet+ to Tet– CD4+ T cells (Figure 6G). In contrast to comparisons with the DN population, few genes showed a greater than 2-fold difference between Tet+ and Tet– CD4+ T cells. Among these, the Ifng gene was upregulated in Tet+ relative to Tet– CD4+ T cells, and this increase was also noticed at the protein level (Supplemental Figure 6).
In summary, RNA-seq revealed a high level of relatedness in the gene expression profiles of Tet+ and Tet– T cells due to their activation status (CD44+), consisting of a heterogeneous population of CD4+ T cells (Th1, Th17, and Tregs) involved in the pathogenesis of CBD. However, their gene expression profiles were significantly different relative to lung CD4+ T cells with a naive phenotype.
Pathway enrichment analysis reveals increased inflammatory gene expression in CCL4/Be-specific T cells (Tet+) compared with naive (DN) T cells. We performed over-representation analysis on differentially expressed genes that were statistically significant (Padj < 0.05) and exhibited at least a 2-fold upregulation in Tet+ T cells compared with DN T cells. This analysis showed significant enrichment of pathways involved in CD4+ T cell development, differentiation, and function, including IL-2/STAT5, TNF-α, and mTORC1 signaling (Figure 7A). The mTORC1 pathway regulates T cell activation, proliferation, and differentiation (e.g., Th1, Th2, and Th17) by integrating signals from antigens, costimulatory molecules, and cytokines, ultimately shaping immune responses and effector functions. Thus, high mTORC1 activity promotes clonal expansion and effector differentiation, while low activity favors Treg development (32). Pathways involved in the inflammatory response and cholesterol homeostasis were also significantly upregulated in Tet+ cells compared with DN T cells (Figure 7B). Cholesterol homeostasis maintains normal T cell function, and disruptions in this pathway can impair T cell activation, differentiation, and cytokine production. Together, these data suggest that, in BeO-exposed HLA-DP2 Tg mice, multiple pathways regulate antigen-specific CD4+ T cell responses.
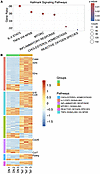 Figure 7
Pathway enrichment analysis of differentially expressed genes in BeO-exposed lung-resident antigen-specific and naive CD4+ T cells. HLA-DP2 Tg mice were intratracheally sensitized and boosted with BeO (100 μg) and LPS (10 μg) as indicated in the Figure 6 legend. (A) Dot plot showing significantly enriched pathways in antigen-specific CD44+Tet+ (Tet+) CD4+ T cells compared with naive (DN) CD4+ T cells. (B) Heatmap showing genes upregulated and downregulated in the indicated immune and metabolic pathways.
Be-specific CD4+ T cell responses are reduced in BeO-exposed HLA-DP2 Tg TNF-α deficient mice. TNF-α induces leukocyte secretion of chemokines, including CCL3 and CCL4, during inflammation and infection (33, 34). Our transcriptomics data show increased gene expression of TNF-α (Figure 6E) and significant upregulation of the TNF-α pathway among HLA-DP2 tetramer-binding T cells (Figure 7A). To directly test the involvement of this cytokine in the development of Be-modified chemokine-specific CD4+ T cell responses, we utilized HLA-DP2 Tg TNF-α–/– mice. On day 21, the frequency and number of CD4+ T cells were significantly reduced in BeO-exposed TNF-α–/– mice compared with the WT mice (Figure 8A). Similarly, HLA-DP2–CCL4/Be tetramer staining of lung cells revealed that mice deficient in TNF-α had a reduced frequency (~3-fold) and number (~7-fold) of antigen-specific CD4+ T cells compared with mice with functional TNF-α (Figure 8B). Next, we assessed IFN-γ and IL-17A CD4+ T cell responses in BeO/LPS-exposed lungs, since both cytokines contribute to granulomatous inflammation (35). BeO exposure resulted in more than a 2-fold reduction in the number of IFN-γ and IL-17A–producing CD4+ T cells in TNF-α–/– mice compared with WT mice (Figure 8, C and D). Finally, histology of lung specimens showed that TNF-α deficiency also reduced Be-associated cellular aggregates in the lungs (Figure 8E). Thus, TNF-α enhances the Be-specific immune response, as evidenced by the reduction of CCL4/Be-specific and cytokine-producing cells in its absence.
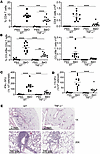 Figure 8
Reduced total and antigen-specific CD4+ T cells in BeO-exposed TNF-α–deficient HLA-DP2 Tg mice. HLA-DP2 Tg WT and TNF-α–/– mice were intratracheally exposed to PBS or BeO/LPS per the standard protocol. (A and B) Data plots show the frequency (left) and number (right) of tissue-resident (A) and HLA-DP2–CCL4/Be tetramer binding (B) CD4+ T cells. (C and D) Data plots show IFN-γ (C) and IL-17A (D) ELISPOT responses as spot-forming units (SFUs) per 100,000 purified CD4+ T cells stimulated with BeSO4 (100 μM). Each data point represents an individual mouse; values are shown as (mean ± SEM) from 2 combined independent experiments. (E) Low (1X) and high (20X) magnification of H&E-stained lung sections from BeO/LPS-exposed WT and TNF-α–/– mice. One-way ANOVA was used to determine statistical significance. **P < 0.01, ***P < 0.001, ****P < 0.0001.
CD4+ T cell cross-reactivity to CCL/Be ligands in the lungs of Be-exposed HLA-DP2 Tg mice. In CBD, a set of CD4+ T cell clones bearing a related CDR3β TCR motif demonstrated cross-reactive responses to Be-dependent CCL3 and CCL4 peptides (7). Because these chemokine epitopes only differ at 3 positions and the amino acid differences are conserved, this observation was not unexpected. A high degree of similarity also exists between mouse and human chemokine sequences. To determine if similar cross-reactivity to the orthologous murine CCL3/4 peptides is present in our animal model of CBD, we costained lung-resident CD4+ T cells from BeO/LPS-exposed HLA-DP2 Tg mice with both HLA-DP2–CCL/Be tetramers, conjugated to different fluorochromes. Single tetramer staining showed that approximately 10% of lung CD4+ T cells stained with either the HLA-DP2–CCL4/Be or the HLA-DP2–CCL3/Be tetramers (Supplemental Figure 7A). However, costaining revealed a large fraction of T cells binding both tetramers, and closer examination showed distinct CD4+ T cell clusters that varied among individual mice and were indicative of their relative binding avidities to both ligands (Supplemental Figure 7, A–C). The overall percentage of T cells that were cross-reactive to the Be-dependent CCL epitopes (i.e., bound to both tetramers) was 47.2% with a large observed range (Supplemental Figure 7C; range, 20%–65%). In summary, these findings indicate that Be2+ exposure produces a similar magnitude of CCL3- or CCL4-specific CD4+ T cell responses in the lungs of exposed mice.
HLA-DP2–CCL4/Be-CAR-T cells limit the in vivo accumulation of chemokine-specific CD4+ T cells in the lungs of BeO-exposed mice. Corticosteroids are the standard treatment for CBD, but this therapy is nonspecific and associated with several risks, including immunosuppression, infections, and other steroid-related effects. CAR-T cells have recently proven effective in treating various forms of cancers and is an emerging area of investigation in autoimmune diseases (36–40). Here, we designed second-generation CAR-T cells containing a CD28/CD3ζ endodomain with an active middle ITAM motif connected to the transmembrane domains of both HLA-DP2 chains. The ectodomain of the HLA-DP2 β-chain also contained covalently attached CCL4 or control peptide (Figure 9A). Given the extensive cross-reactivity of T cells to the CCL3 and CCL4 peptides (Supplemental Figure 7), we predicted the CAR-T cells would effectively eliminate most T cells with antigen specificity to either of these epitopes. Negatively enriched CD3+ T cells from CD45.1 congenic mice were activated overnight in culture and transduced with retroviruses separately encoding the HLA-DP2 α-chain marked by EGFR and the β-chain with NGFR. Transduction efficiencies, defined as T cells expressing both EGFR and NGFR, were routinely 50%–70% of total CD3+ T cells (Figure 9B). In vitro stimulation of CAR-T cells with plate-bound mAb confirmed the ability of the transduced T cells to signal through their CARs and secrete IL-2 (Figure 9C). To assess the efficacy of HLA-DP2 CAR-T cells, BeO/LPS-exposed HLA-DP2 Tg mice were adoptively transferred with 6 × 10⁶ DP2-CCL4/Be-CAR-T cells or DP2-DRα-CAR-T cells on day 8 after briefly exposing the DP2-CCL4/Be-CAR-T cells to BeSO4 (50 mM) to generate the ligand for cognate TCRs. Mice were sacrificed on day 21, and HLA-DP2 tetramer staining of individual nontreated and CAR-T cell–treated mice is shown in Figure 9D. Compared with the nontreated BeO/LPS-exposed group, mice adoptively transferred with CCL4/Be-CAR-T cells showed a significant reduction in the frequency and number of lung-resident CD4+ T cells (Supplemental Figure 8) and CD4+ T cells binding the HLA-DP2–CCL4/Be (Figure 9E) and HLA-DP2–CCL3/Be (Figure 9F) tetramers. Transfer of nonspecific DP2-DRα-CAR-T cells had no affect on these antigen-specific cell populations (Figure 9, D and F). Importantly, H&E staining of lung tissues showed a significant reduction in inflammation, determined by the presence of cellular aggregates, in BeO-exposed HLA-DP2 Tg mice treated with CCL4/Be-CAR-T cells compared with BeO-exposed control groups treated with no CAR-T cells or nondisease-specific DP2-DRα-CAR-T cells (Figure 9, G and H). These data demonstrate that CCL4/Be-CAR-T cells effectively reduce CCL/Be-specific CD4+ T cells in the lungs of BeO-exposed mice.
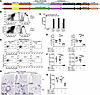 Figure 9
Reduced frequency of CCL/Be-specific CD4+ T cells in the lungs of BeO-exposed mice treated with HLA-DP2/CCL4-CAR-T cells. (A) Organization of MSCV vectors shows CARs expressing ecto- and transmembrane domains of the HLA-DP2 α-chain (top) and the β-chain (bottom), both connected to CD28/CD3ζ-ITAM-2-live. Peptides (derived from DRα or CCL4) are covalently attached to the N-terminus of β-chain by a linker. (B) Flow cytometry plots show representative transduction efficiencies (left, double positive gated population) and HLA-DP2 CAR expression (right) with either the DRα-peptide (top) or CCL4 peptide (bottom) on day 4 post-transduction. (C) IL-2 ELISA shows that the HLA-DP2–CCL4/Be CAR expressed on CD3+ mouse T cells can signal transduce and produce IL-2 in response to plate-bound mAb. (D) Representative HLA-DP2–CCL4/Be (top) and HLA-DP2–CCL3/Be tetramer staining of lung-resident CD4+ T cells in HLA-DP2 Tg mice exposed to BeO/LPS and treated with and without CAR-T cells. (E and F) Frequency (top, E) and number (bottom, F) of CCL3/Be- and CCL34/Be-specific CD4+ T cells in the lungs of BeO-exposed mice treated with CAR-T cells. (G) H&E staining showing low (1X) and high (20X) magnification of lung tissues and quantification of cellular aggregates (H) in BeO-exposed lungs, either untreated or treated with control CAR-T cells (DRα-CAR-T) or CCL4 CAR-T cells (CCL4-CAR-T) on day 8 and examined on day 21. Data are shown as mean ± SEM, pooled from 2 independent experiments. One-way ANOVA was used to determine statistical significance. **P < 0.01, ****P < 0.0001.


